
Compost increases bush bean vigor and survival; offspring of Gurbani exposed plants have stronger response to temperature stress.
Sustainable Agriculture Student Research Project
Effects of Gurbani, compost, and biochar on bush bean vigour over two generationsAnupjot Badesha, Department of Sustainable Agriculture, 2025 |
Introduction
Cultural aspect:
- Elders encourage pregnant women to recite and listen to Gurbani so the child can get the benefits
- Elders also would have a bowl of water when meditation upon Gurbani so that its effects and their intentions can be transferred to the water and that water then given to their family
- The Sikh philosophy suggest that all living beings possess a soul and Gurbani is viewed as food for the soul
Scientific aspect:
- Phytoacoustics is an emerging scientific field with the focus of studying the effects of sound on plants
- Gurbani has not yet been used as a sound treatment within phytoacoustics
- Water exposure to intentions and sound has been studied
- Effects of sound on soil and water have seldom been studied
General Trend:
- There is tension in science when it comes to spirituality and in spirituality when it comes to science
- Phytoacoustics is a new field results produced are contested, as the mechanism(s) behind how plants interact with sound are not fully defined and or understood
- The above is not a defense, but rather the general trend
Treatments: Sound, Water, and Soil Amendments
- Gurbani is the various compositions written by Sikh Gurus and Bhagats
- Emphasis is placed on its vocalization and singing
- Compost is a source of nutrients for plants and is also used to restore soil organic matter, but nutrient leaching is an issue
- Organic matter + pyrolysis = Biochar (stabilized cardon) has high porosity that helps with nutrient and water retention, but can immobilize nutrients
- Both compost and biochar, as soil amendments, have shown to benefit cation exchange rate, aeration, water retention, and microbial communities
- Combining (mixing) both has shown to be synergistic and helpful against nutrient leaching
Objective
- Use bush beans as a biological proxy for understanding the cultural intuition about Gurbani’s direct effect through sound and indirect effect through water on vigor and survival of plants that are grown in soil amended with biochar, compost, and biochar + compost (indicating environmental stress) over two generations
Methods
Materials:
- Mineral soil from KPU Farm (49.1758257, -123.1213951)
- Compost (Anaconda Systems, Burnaby, BC)
- Biochar (BC Biocarbon, Carrot River, SK)
- Growth chamber, GEN1000 (?) (Conviron, Winnipeg, MB, Canada)
- Dehydrator
- SPAD-502Plus (Konica Minolta Sensing Europe B.V.)
- BW-150 SHIPPING SCALE (Western Scale Co. Ltd., BC, Canada)
- High Precision Scale (Starfrit, USA)
- Portable speaker, Model # S-00163 no longer in production, new model (Ultimate Ears, USA)
- Brass Caliper (Lee Valley, Vancouver, BC, Canada)
- Rubbermaid Roughneck Stackable Storage Box with Lid, 53-L, Blue (Canadian Tire, Canada) (x8)
- Generic black plastic 1-gallon pots (KPU Farm) (x48)
- Generic black plastic watertight flower bouquet pots (KPU Farm) (x2)
- Generic black plastic transplanting trays (KPU Farm) (x2)
- Generic black plastic shoe trays (KPU Farm) (x2)
- Wooden posts (KPU Farm) (2)
- 4 strand, 20-gauge, galvanized utility wire (Hillman [OOK], USA)
- 12-guage, multi-purpose wire (Hillman [OOK], USA)
- ScotchBlue™ Original Multi-Surface Painter's Tape 2090 (3M, Canada)
- Plastic Dressing Containers, 60ml (Rama Design, Dollarama, BC, Canada)
- Recycled Grocery Bags, 6 x 4 1⁄16 x 12 3⁄8", #8, Kraft (Uline, Lacey, WA, USA)
- OnePlus 6T, smartphone (Shenzhen, Guangdong, China)
- Sikh World, application (Google Play Store, Version 30.7)
- Sound Meter, application (Google Play Store, Version 11.0)
- Spotify, application (Google Play Store, Version 9.0.96.826)
- Audacity, application (Version 3.7.5)
- Gurbani Shabad sampled, Jap Ji Sahib, 0:00 – 0:28 (YouTube, Sant Niranjan Singh)
Location
- KPU Farm (Fig. 1)
Image
Experimental Design (Generation 1)
- Completely Randomized Factorial Design (02/06/2025 – 19/09/2025)
- Gurbani: sound treatments
- 2 levels: Gurbani and Ambient
- Recorded Gurbani exposure time 47:42 minutes/day
- Ambient sound exposure time (roughly, takes time to move pots) 47:42 minutes/day
- Given between 05:00 – 07:30 weekdays (minus 3 sick days)
- Which sound treatment would go first was randomized for the given day
- Gurbani: water treatments
- 2 levels: Gurbani and Ambient
- Water in pot treated for time 47:42 minutes/day, between 05:00 – 07:30 weekdays (minus 3 sick days)
- Water given to plants after both sound treatments were finished and plants brought to home site
- Water was given in association with the randomization of sound treatments, if ambient sound treatment was given first, then ambient sound treated water was given first
- Water pot did not change location during experiment
- Soil: amendment treatments
- 4 levels: control (mineral soil), biochar, compost, and biochar + compost (n = 48)
- 50/50 v/v was linked to w/w by the following ratio 1.395 kg (mineral soil): 0.51 kg (compost)
- Biochar was mixed compost at 11.11% by weight, 10.8 kg compost and 1.2 kg biochar with 2l of water to make “biochar + compost”
- Biochar + compost was mixed daily for 18 days to allow biochar to incorporate into compost
- Control pots (x12) = 2.79 kg mineral soil
- Biochar amended pots (x12) = 2.733 kg mineral soil + 0.0567 kg biochar
- Compost amended pots (x12) = 1.395 kg mineral soil + 0.51 kg compost
- Biochar + compost amended pots (x12) = 1.395 kg mineral soil + 0.51 kg biochar + compost
- Locations of plant pots, within the 5 x 5 grid, was randomized and both sound treatment groups had the same location layout for the given day
- Intentions: control
- Recorded Gurbani from Sant Niranjan Singh Ji was used as it would not have my personal intentions related to the outcome of this experiment, if I had recorded my voice
- An Ardas (formal prayer) was made, so that my intentions may remain pure and not interfere with the experiment, before leaving home to go to KPU Farm to commence that day’s sound treatments
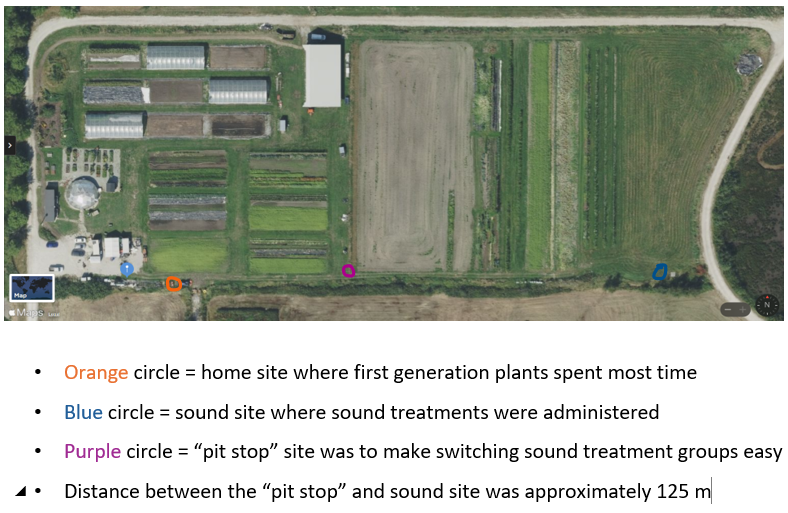
- Sound treatment site (Fig. 2)
- Both the speaker and the water treatment pot remained in the same location throughout the experiment
- Plant pots were arranged in a 5 x 5 grid (and numbered from 1 – 24), and their location was randomized for the weekdays, however the randomized location layout was kept same between the two sound treatments
- It was randomized which of the two sound treatments (1 = Gurbani and 2 = Ambient) would get to go first for the weekdays
- These randomizations were done on the Monday of every week as to make it easy to keep track these changes
- Randomizations were done through the “true random number generator” and “random integer generator” modules within Random.org
Image

Data Collection (Generation 1)
- Measurements: weekly
- Start date: 07/07/2025
- Survival of each plant (days) with termination day being 110 days after sowing
- Number of fully developed and open leaves for each plant
- SPAD reading were taking from same leaves as ones used to measure average leaflet surface area of the three sizes (consistency of this measurement was dependent upon life stage of plants)
- Pest damage was counted on a per leaflet basis
- Malformed leaves (more or less than 3 leaflets per leaf) were counted on a per leaf basis
- Disease and deficiency were counted on a per plant basis
- Measurements: bi-weekly
- Start date: 07/07/2025
- Total leaf surface area was calculated by getting the average surface area of one leaflet from small, medium, and large leaves (that were fully developed and horizontal), and then put into the following equation: Total Leaf Surface Area (cm2) = [(leaflet small + leaflet medium + leaflet large) x 0.7] x number of leaves (consistency of this measurement was dependent upon life stage of plants)
- Measurements: once
- Plants that “died” (were going to fully decompose by the end of experiment if not preserved) during the experiment were cut at soil level, placed in plastic bags, and stored in the freezer to preserve the organic matter
- Surviving plants were cut at the soil level, stored in paper bags, and dried at room temperature at home under a ceiling fan for air circulation from 19/09/2025 – 16/10/2025
- Beans were harvested and weighed on the 16/10/2025 and all parts of the plants were stored back in the paper bags
- Both the “dead” and “surviving” groups were dried in a dehydrator at 70°C for 5 days to get the dry weight of plants, each group was dried and weighted separately
Experimental Design (Generation 2)
- Generation 2: Split-plot in Randomized Complete Block Design (20/10/2025 – 30/10/2025)
- Whole-plot factor: Temperature-based stress (high and low)
- Sub-plot factor: Parent plants that completed their life cycle (n = 24)
- Randomization:
- A classmate randomly selected four seeds from each parent plant per tray
- Seed location within each tray was randomized between each tray
Image

- Layout in growth chamber
- 24 parent plants survived with 12 from each sound treatment, with each plant given a series of four integers for the purpose of randomizing; for example, plant 2 was given the numbers 1, 2, 3, and 4 as seed IDs
- 105 soil blocks (30 x 30 x 30 mm) were within each tray with 96 blocks being occupied by 4 seeds randomly selected by a classmate from each of the 24 surviving parent plant for each tray
- Random integer generator module from Random.org was used to randomize the location of each seed within the 105 soil blocks; if we get number, then we know to take a seed that belonged to plant 2 and place within the soil block given the ID of 1 and if any numbers above 96 were pulled, then those blocks were left empty
- Trays were bottom watered with 1.5 Lof water
- Watering schedule as per the 10 days: day 1 (1h), day 2 (1h), day 3 (0.5h), day 4 (0h), day 5 (0.5h), day 6 (1h), day 7 (0h), day 8 (1h), day 9 (0.5), and day 10 (0.5h)
- Water schedule was dependent upon how much free time I had, full hydration of soil blocks (when the vermiculite layer at the top was damp) was reached by the 0.5 h mark, and zero hours of watering was done so to not over water seedlings and because day 7 landed on a Sunday and the lab was closed
Data Collection (Generation 2)
- Shoot and root length of each seedling measured 10 days after seeding
Statistical Analysis
- Statistical software: jamovi interface for R
- Critical value for significance: 0.05
- All higher-level interactions were kept within the statistical model for the purpose of keeping the resulting significant interactions conservative
- The compost treatment was excluded from analysis due to not allowing analysis to take place
- Assumptions about homogeneity and normality were checked and conformed to prior to performing statistical analysis
Generation 1: Modules + specifications
- Survival analysis (on days survived) was performed using the ClinicoPath Survival module in jamovi
- Data not transformed
- Time Elapsed variable: survival (days)
- Outcome variable: death (event level denoted as 1)
- Explanatory variable: soil amendment types
- Survival curves were plotted and Log-rank p – value gained (p < 0.0001)
- Descriptive graph used to as easier to understand (variable = days survived and split by = soil)
- Repeated Measures ANOVA analysis (number of leaves) was performed using the ANOVA module in jamovi
- Dates excluded to meet homogeneity assumption: July (7 and 31) and August (21 and 27)
- Greenhouse-Geisser correction was used adjust to for sphericity and given p – values used to assess statistical significance
- Repeated Measure Factor (dates): July (17 and 24), August 15, and September (3, 9, and 18)
- Between Subject Factors: biochar, sound, and water
- Repeated Measures ANOVA analysis (total leaf surface area) was performed using the ANOVA module in jamovi
- Dates excluded to meet homogeneity assumption: July (7) and August (21)
- Repeated Measure Factor (dates): July (24) and September (3 and 18)
- Between Subject Factors: biochar, sound, and water
- Repeated Measures ANOVA analysis (SPAD reading) was performed using the ANOVA module in jamovi
- Dates excluded to meet homogeneity assumption: July (7) and August (15 and 21), and September (9 and 18)
- Repeated Measure Factor (dates): July (17, 24, and 31), August (27) and September (3)
- Between Subject Factors: biochar, sound, and water
- ANOVA analysis (bean yield) was performed using the ANOVA module in jamovi
- As only compost amended plants produced yields, a filter was used to exclude plants from the control and biochar treatments
- Another filter was to exclude a single diseased plant with a yield of 0.9 g (outlier)
- Dependent variable: Yield (g)
- Fixed factors: biochar, sound, and water
Generation 2: Modules + specifications
- Linear Mixed Model analysis (shoot + root lengths) was performed by using the GAMLj3 module in jamovi
- Length < 10 cm was filtered due to being outliers (total data filtered out = 8)
- The remaining data was transformed using BOXCOX to conform to assumptions of normality
- Dependent variable: BOXCOX (shoot + root lengths)
- Fixed factors: biochar, sound, water, temperature-based stress
- Cluster (random) variable: parent plant ID
Results
Image

Image

Image

Image

Image

Image

Image

Image

Image

Image

Image

Conclusion
- Compost increases bush bean vigor and survival
- Some positive and negative effects are seen from Gurbani and biochar
- Bush bean seedlings from parents exposed to Gurbani have a stronger response to temperature-based stress
Acknowledgments
I would like to thank the faculty, Anaconda Systems and Preterra BioCarbon Solutions Ltd., KPU Farm staff, mentors, friends and classmates, and family for their support and guidance in the physical, mental, emotional, and spiritual domains.
Finally, I would like to extend thanks to the being that exists beyond the domain of time for being the architect behind this experiment and its execution.
Raw Data