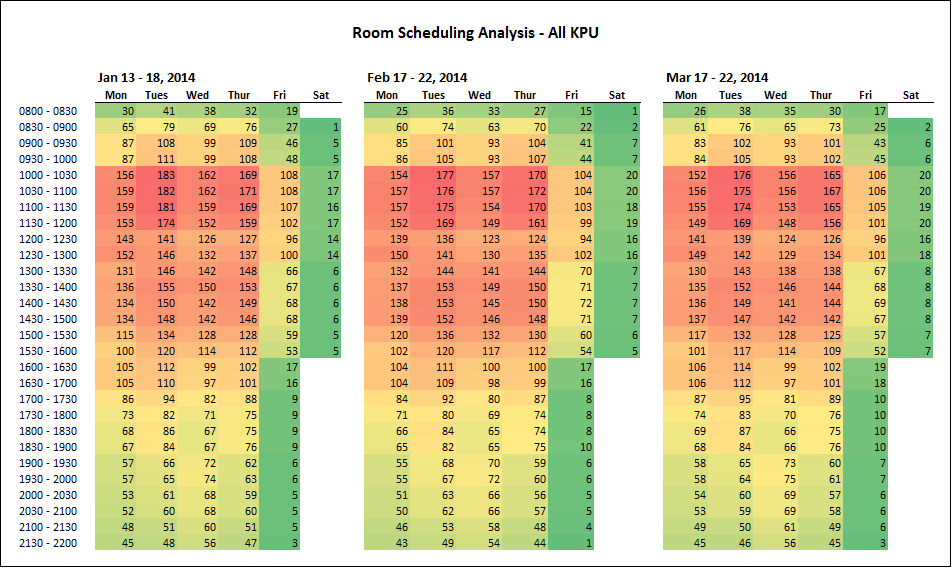
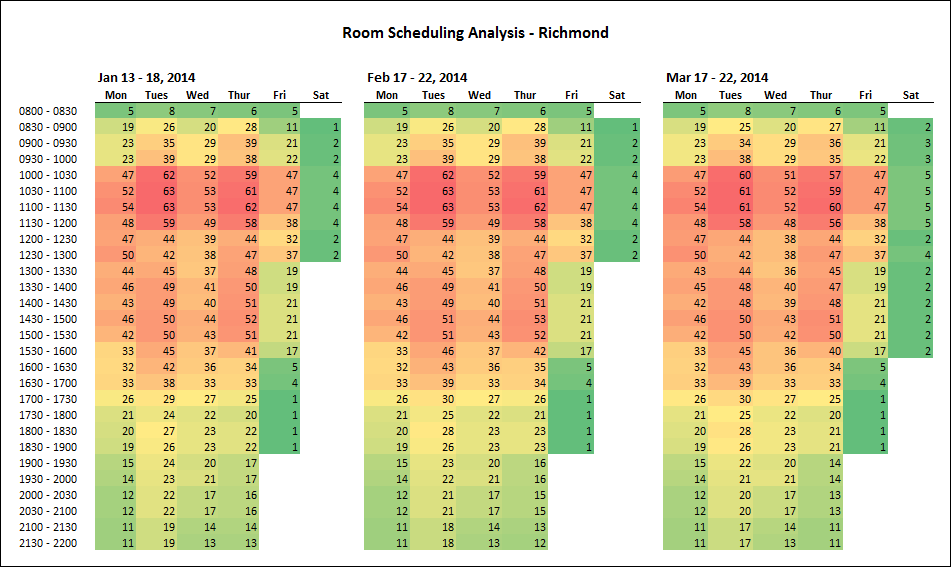
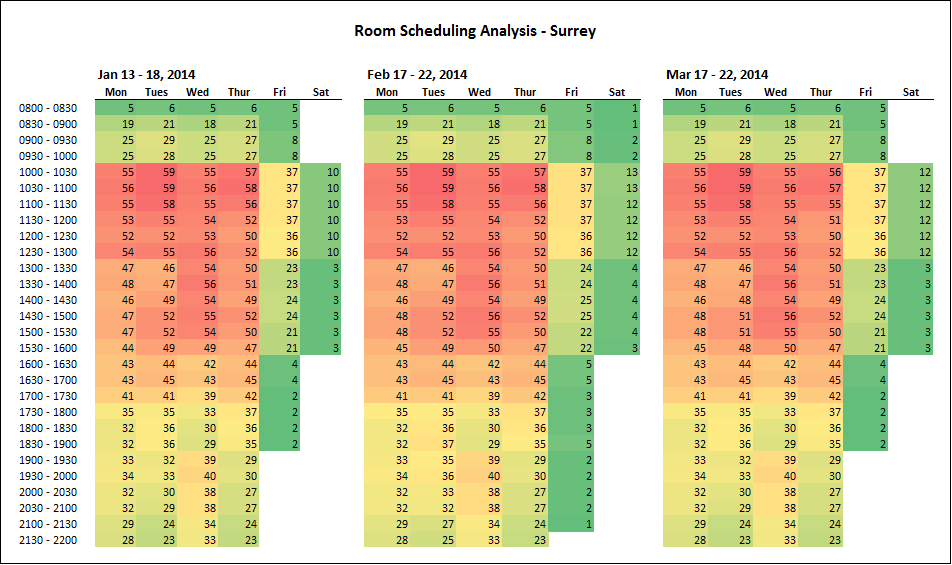
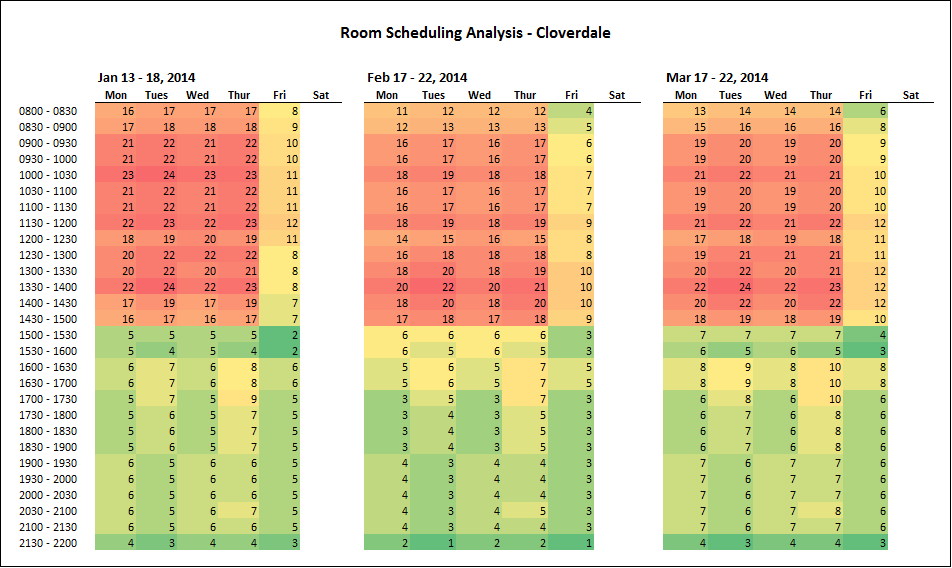
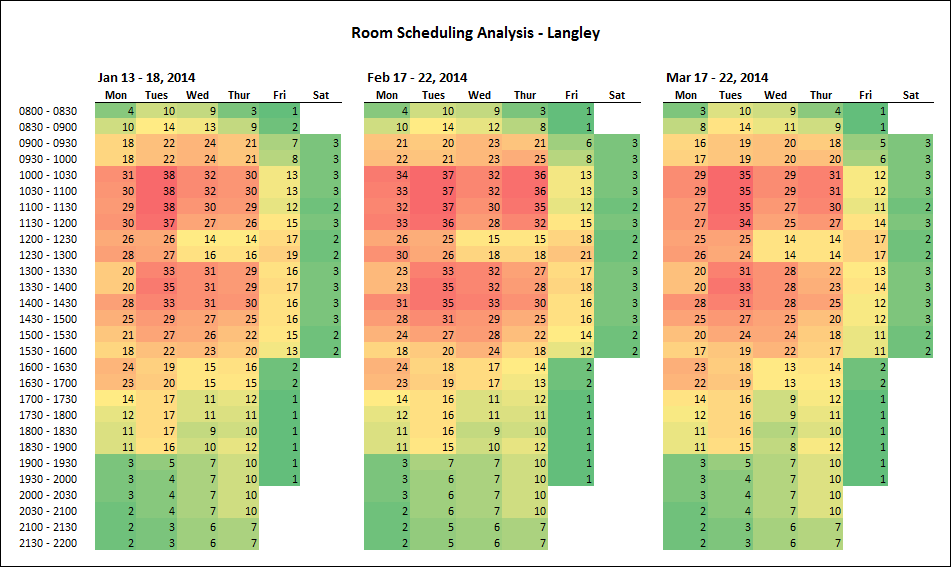
Key to Room Scheduling Analysis Charts
The numbers in each cell represent the number of rooms (including classrooms, labs, shops, and studios) scheduled at that time.
The colour coding indicates the proximity to maximum room use; red indicates maximum use or very close to it and green indicates that no, or very few, classrooms are scheduled.
These charts showing how many rooms are scheduled at which times over a week were prepared by the Registration and Scheduling Department of the Registrar’s Office.
Image
Image
Image
Image
Image
Image
