
Check out KPU’s latest sustainability performance across our academic, operational, and community-focused areas of work, with an aim to foster transparency, support informed decision-making, and encourage community engagement and action.
STARS Report
Learn More about KPU’s STARS Report
KPU STARS Report 2024 | V2.2
An institution’s STARS score is based on the percentage of applicable points earned in credits across four main categories: academics, engagement, operations, and planning & administration.
Academics Category
The academics category evaluates how well an institution integrates sustainability into their course offerings and research. Credits for research under STARS V2.2 apply to institutions where research is considered in employee promotion or tenure decisions. KPU does conduct research in sustainability but as a polytechnic university does not require research in employee promotion, therefore did not pursue this credit.
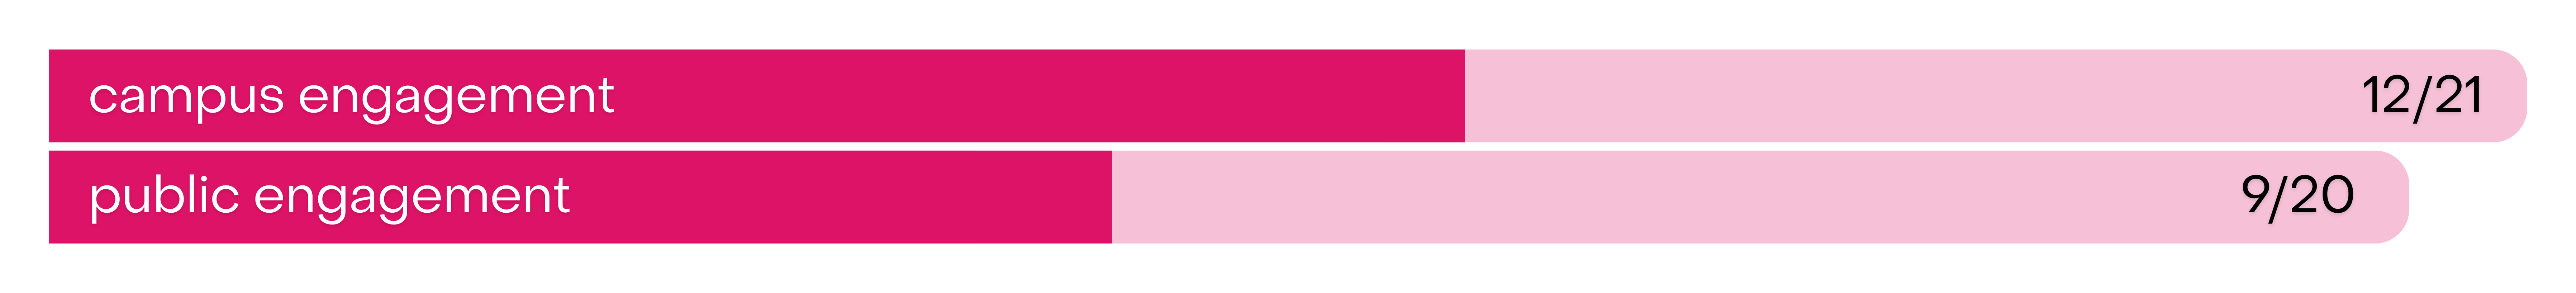
Engagement Category
The engagement category evaluates how institutions promote sustainability through outreach, education, and collaboration with both internal and external stakeholders.
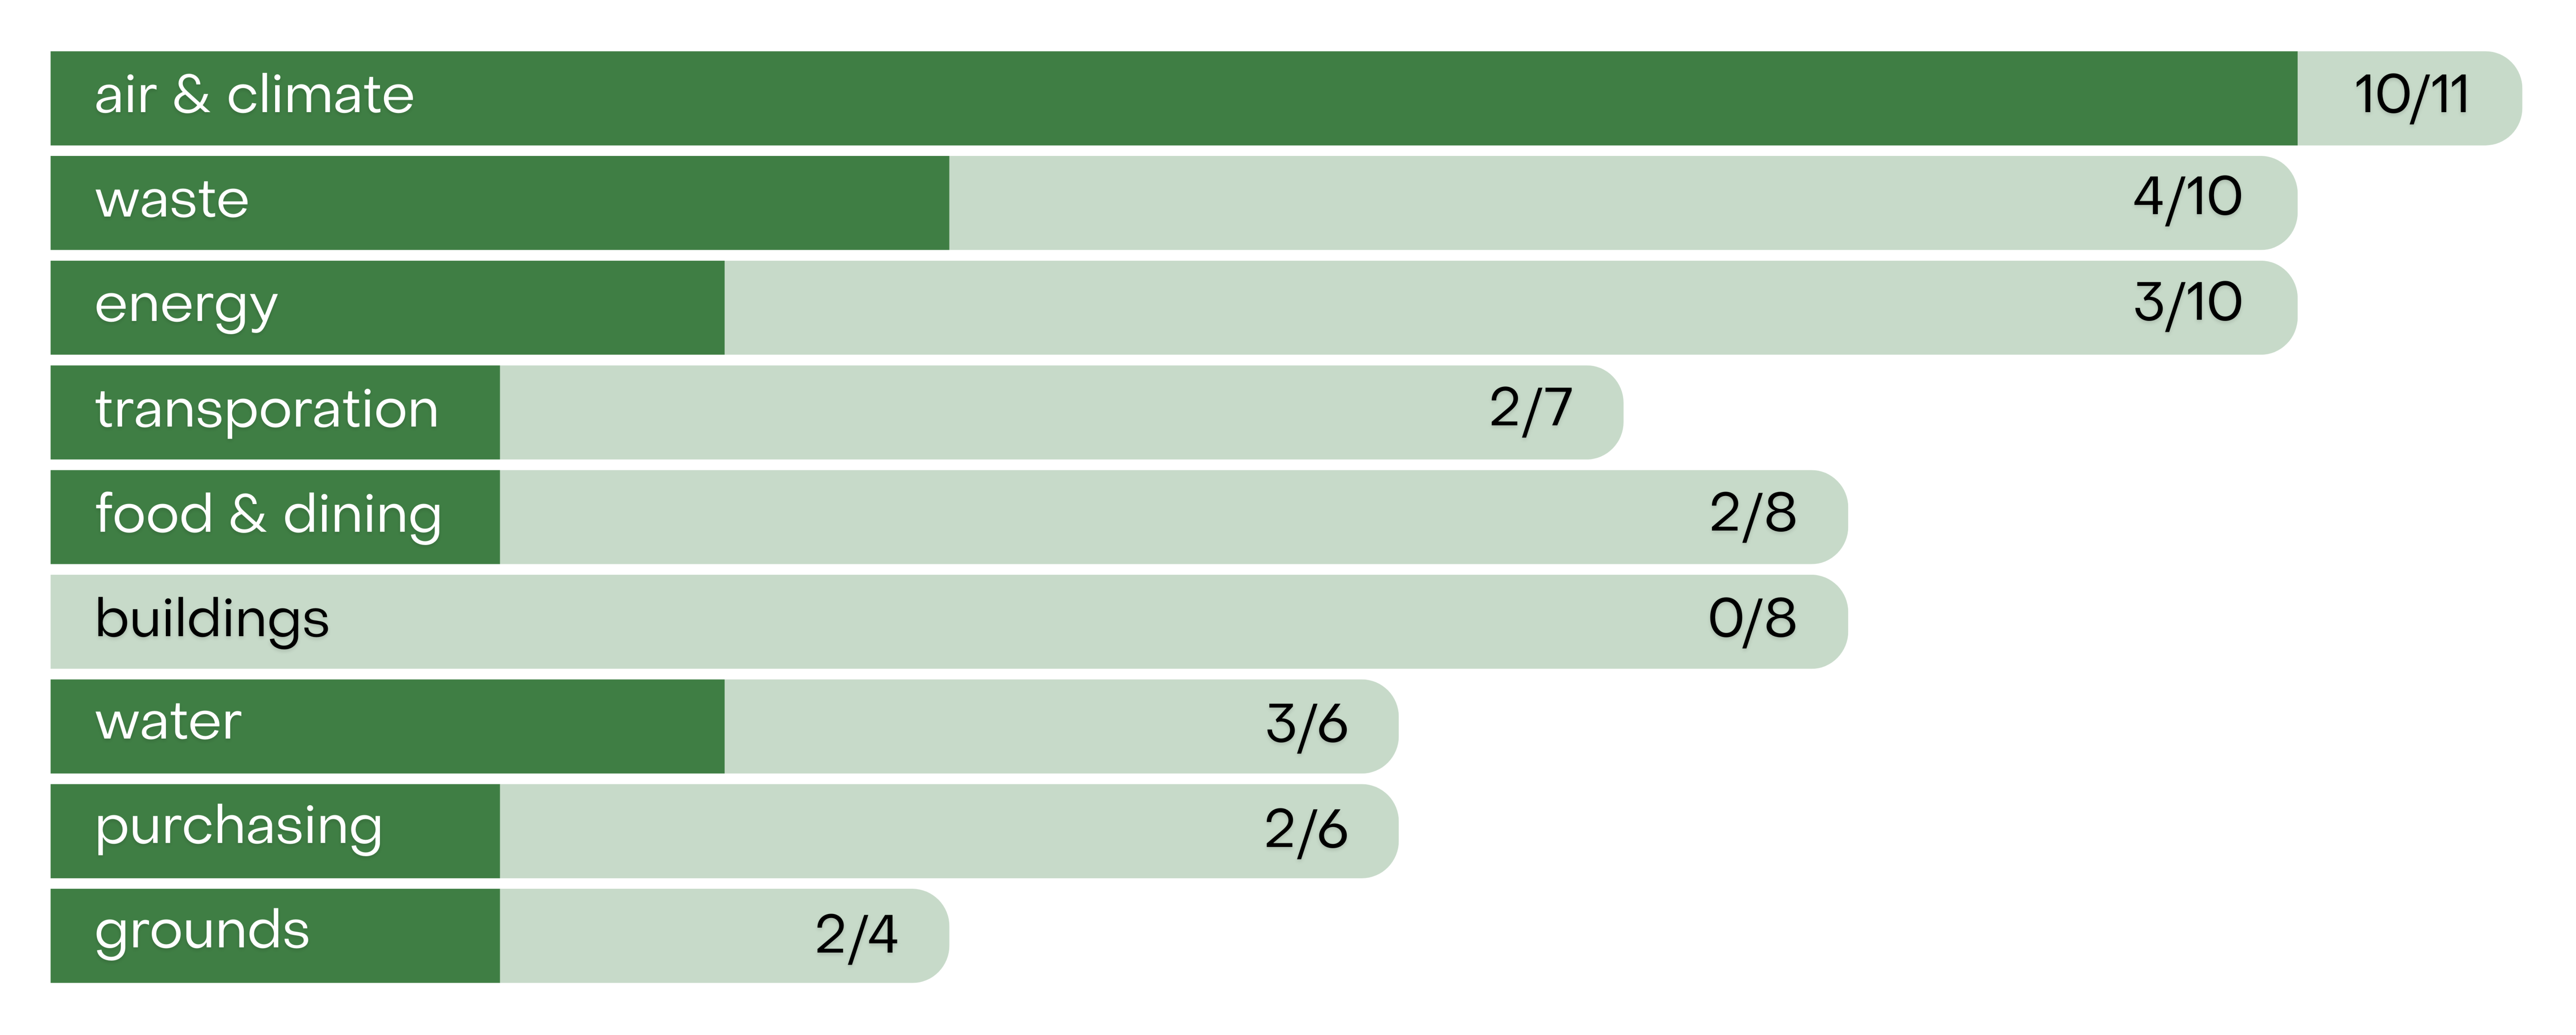
Operations Category
The operations category focuses on the sustainability performance of an institution's physical operations and collectively aim to minimize the environmental footprint of higher education institutions and promote sustainability in their day-to-day operations.
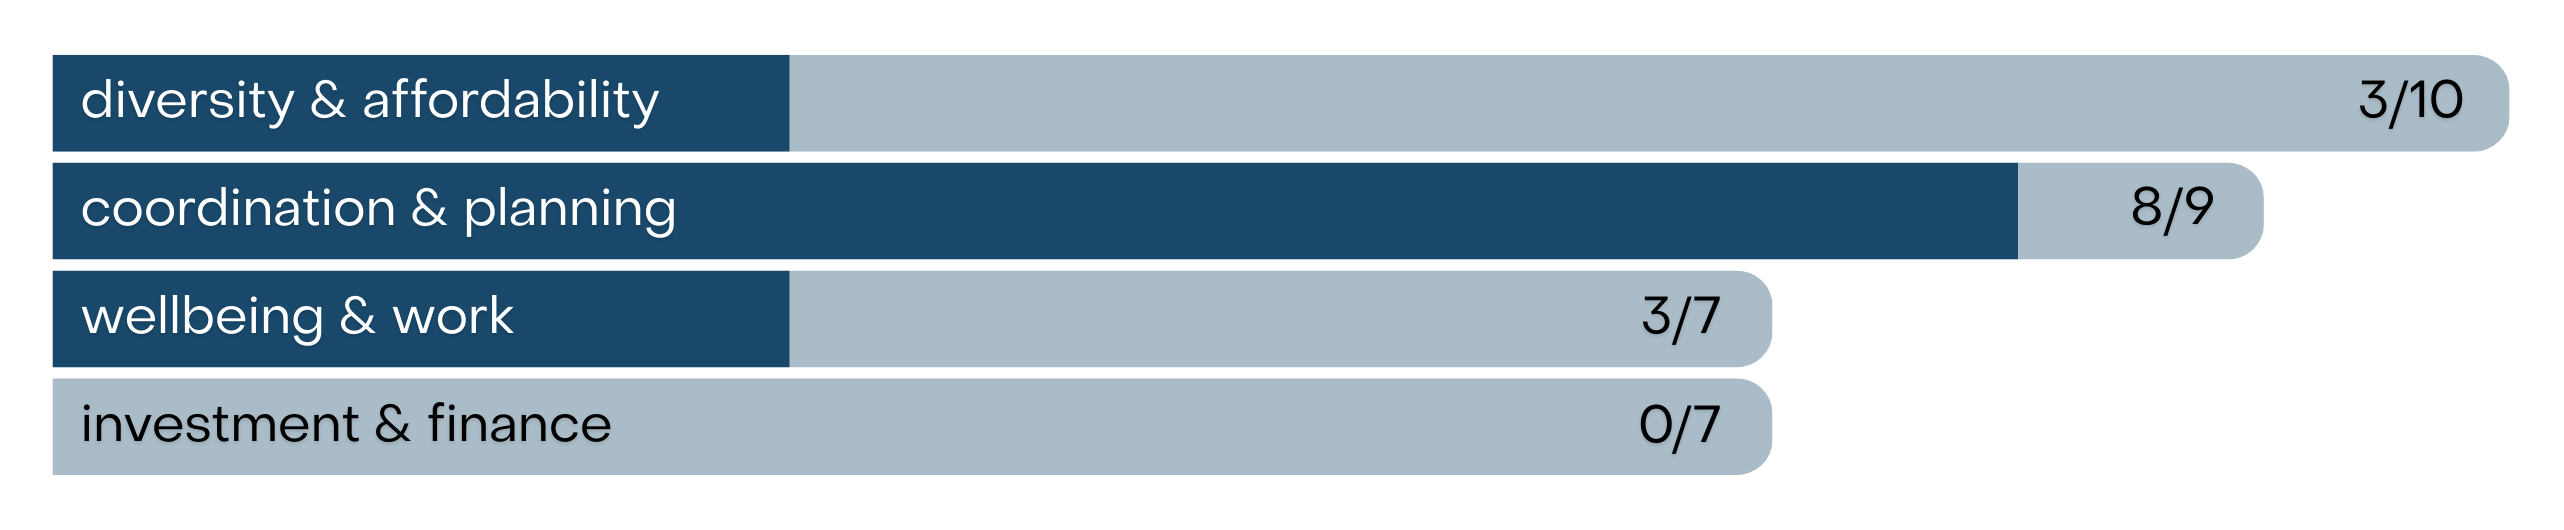
Planning and Administration Category
The planning and administration category evaluates how well an institution embeds sustainability into its long-term planning, governance, diversity and inclusion efforts, investment practices, and human resource programs and policies.
Climate Mitigation and Resilience

Net Zero by 2050
KPU has committed to the UN Environment Programme’s “Race to Zero” target of net zero greenhouse gas emissions by 2050.
DESIRED TREND ↑ increase

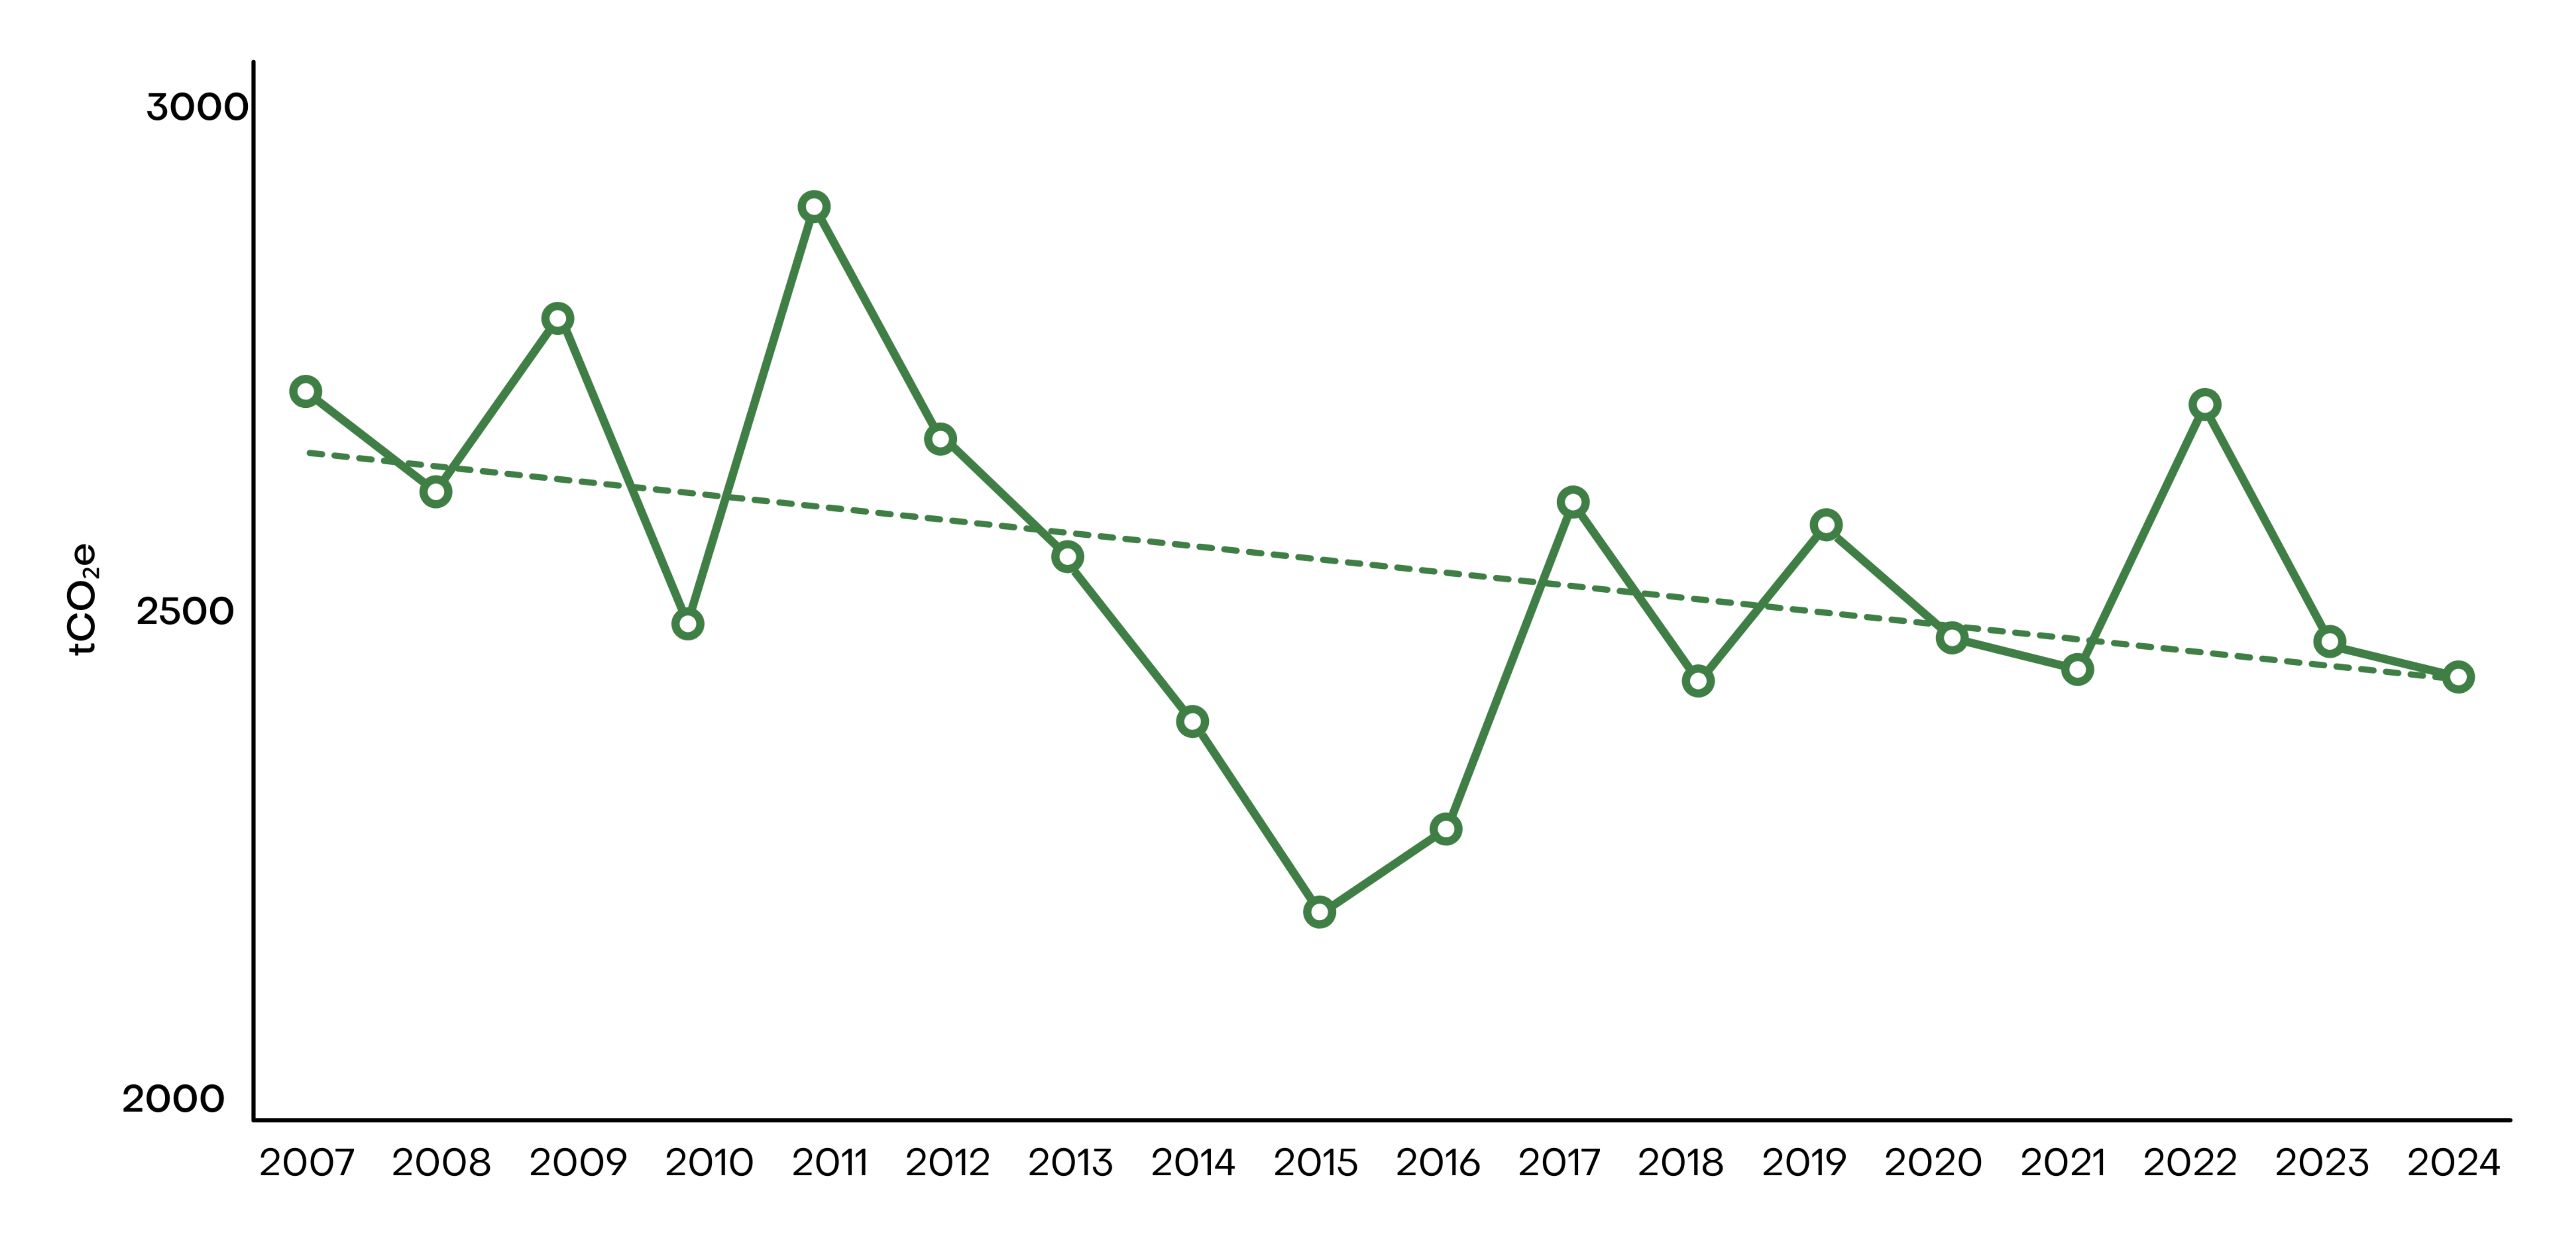
12% reduction in building greenhouse gas emissions
Even as KPU’s campuses have grown, we have found ways to reduce our annual building emissions by 237 tCO₂e compared to 2007.
DESIRED TREND ↓ decrease

Scope 3 commuting emissions
of the KPU community are almost 4x more than building emissions.
DESIRED TREND ↓ decrease
Learn More about Climate Mitigation and Resilience
Greenhouse Gas Emissions Consumption for all KPU Buildings
Greenhouse Gas Emissions Consumption by Campus
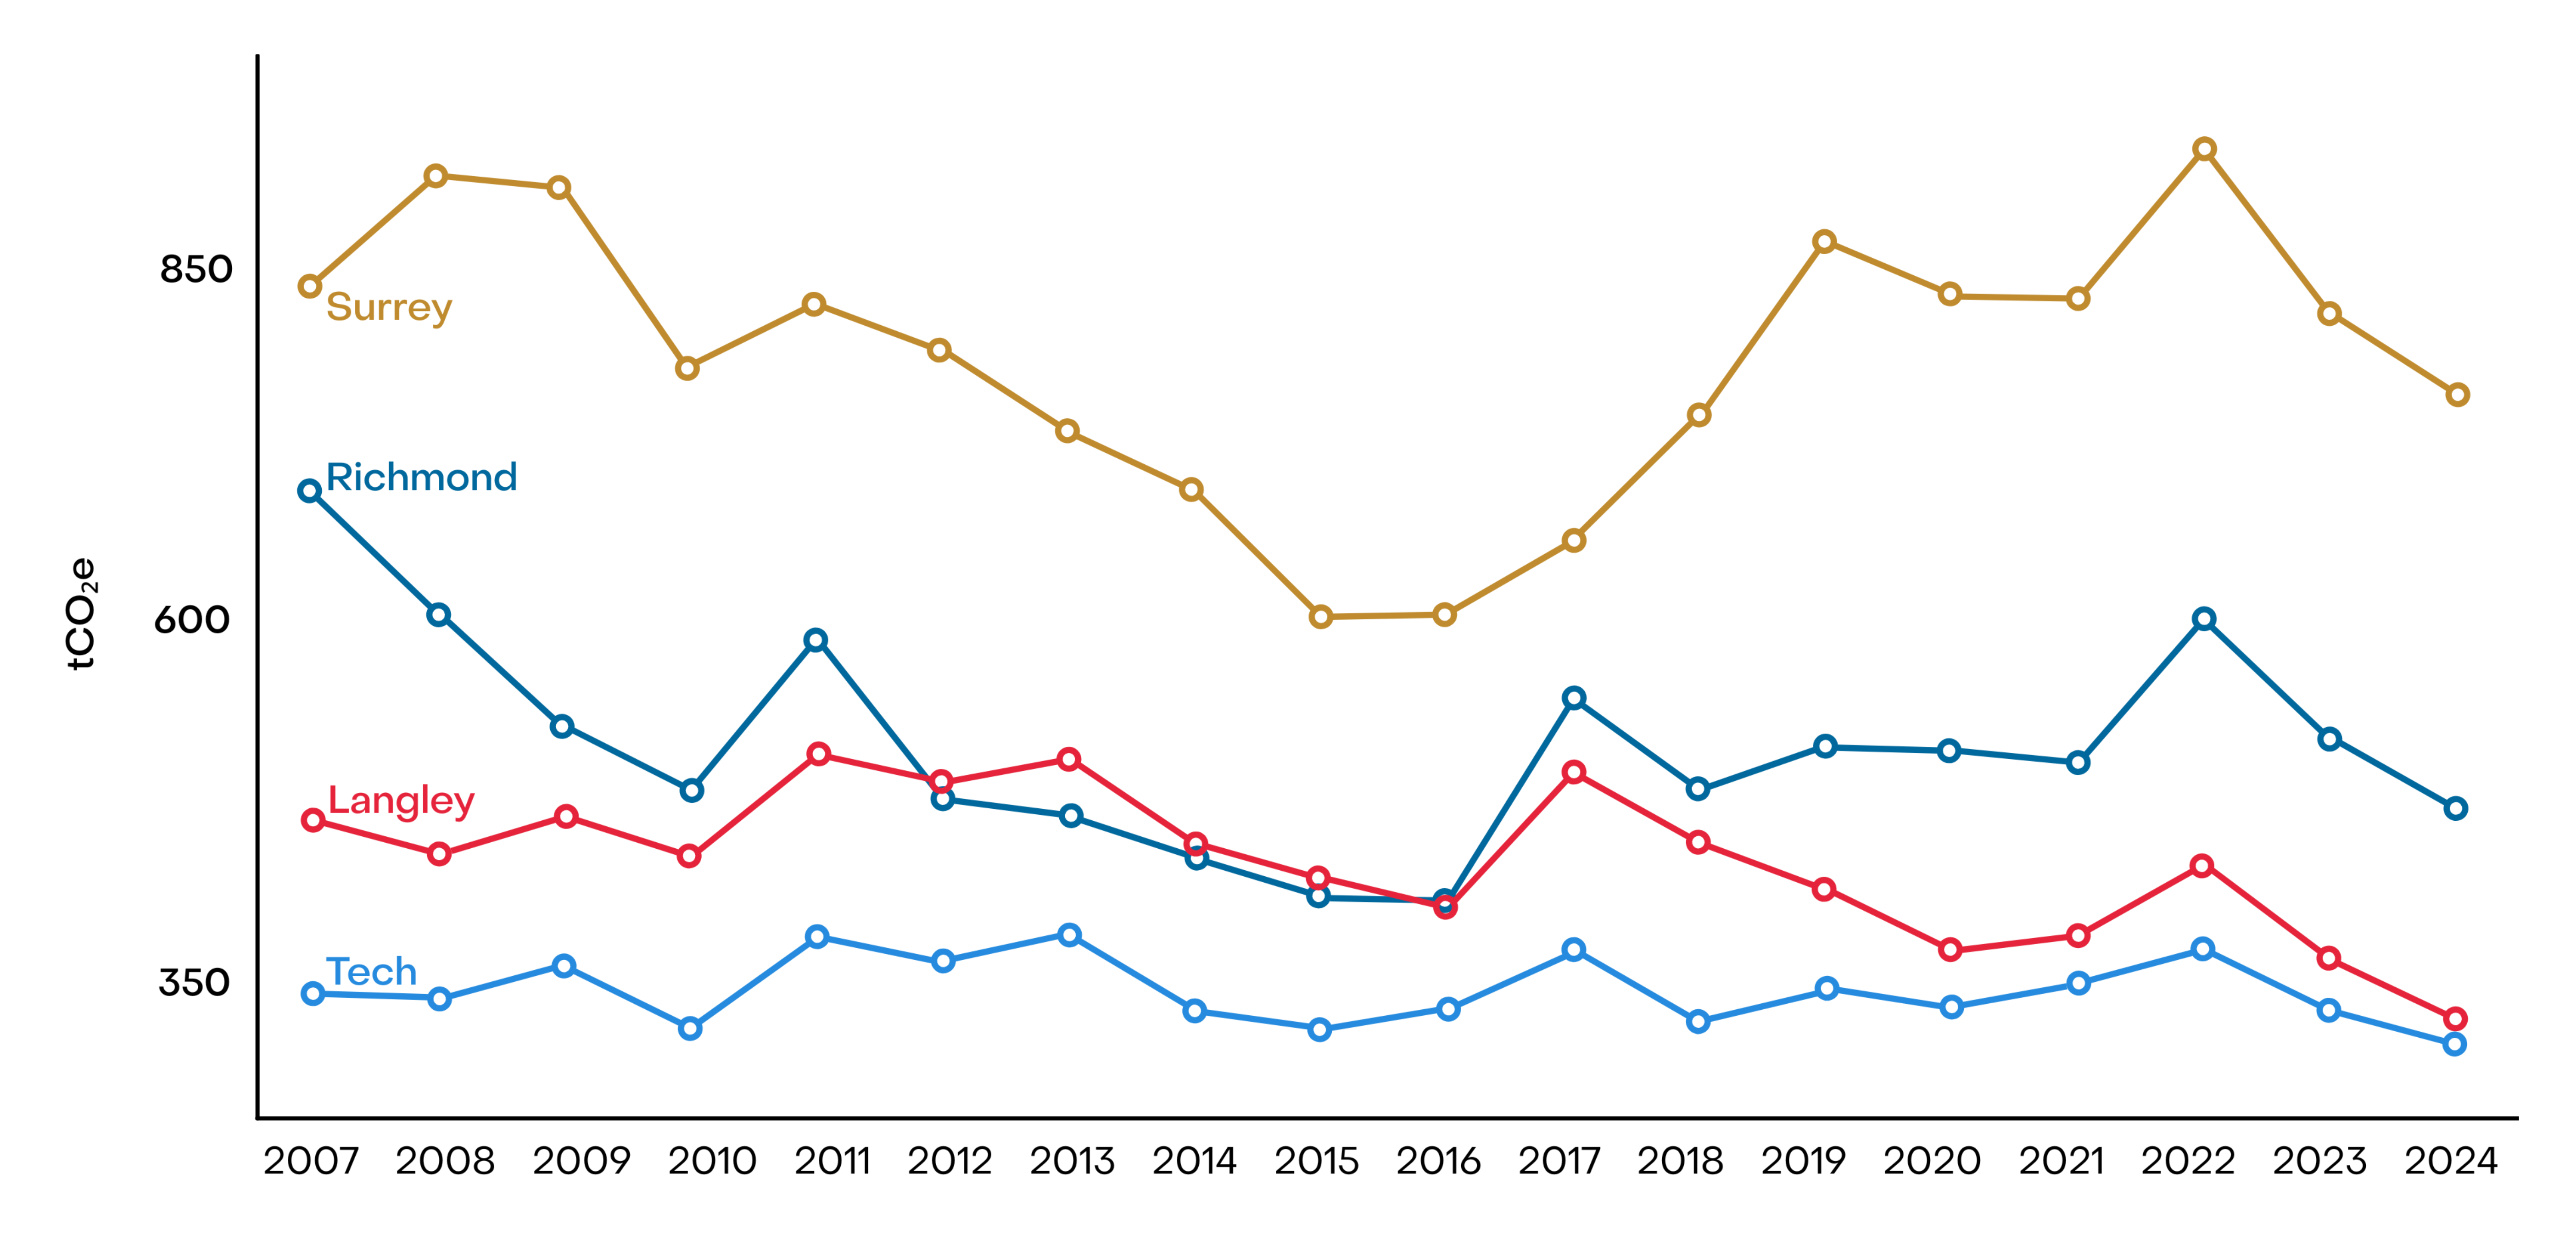
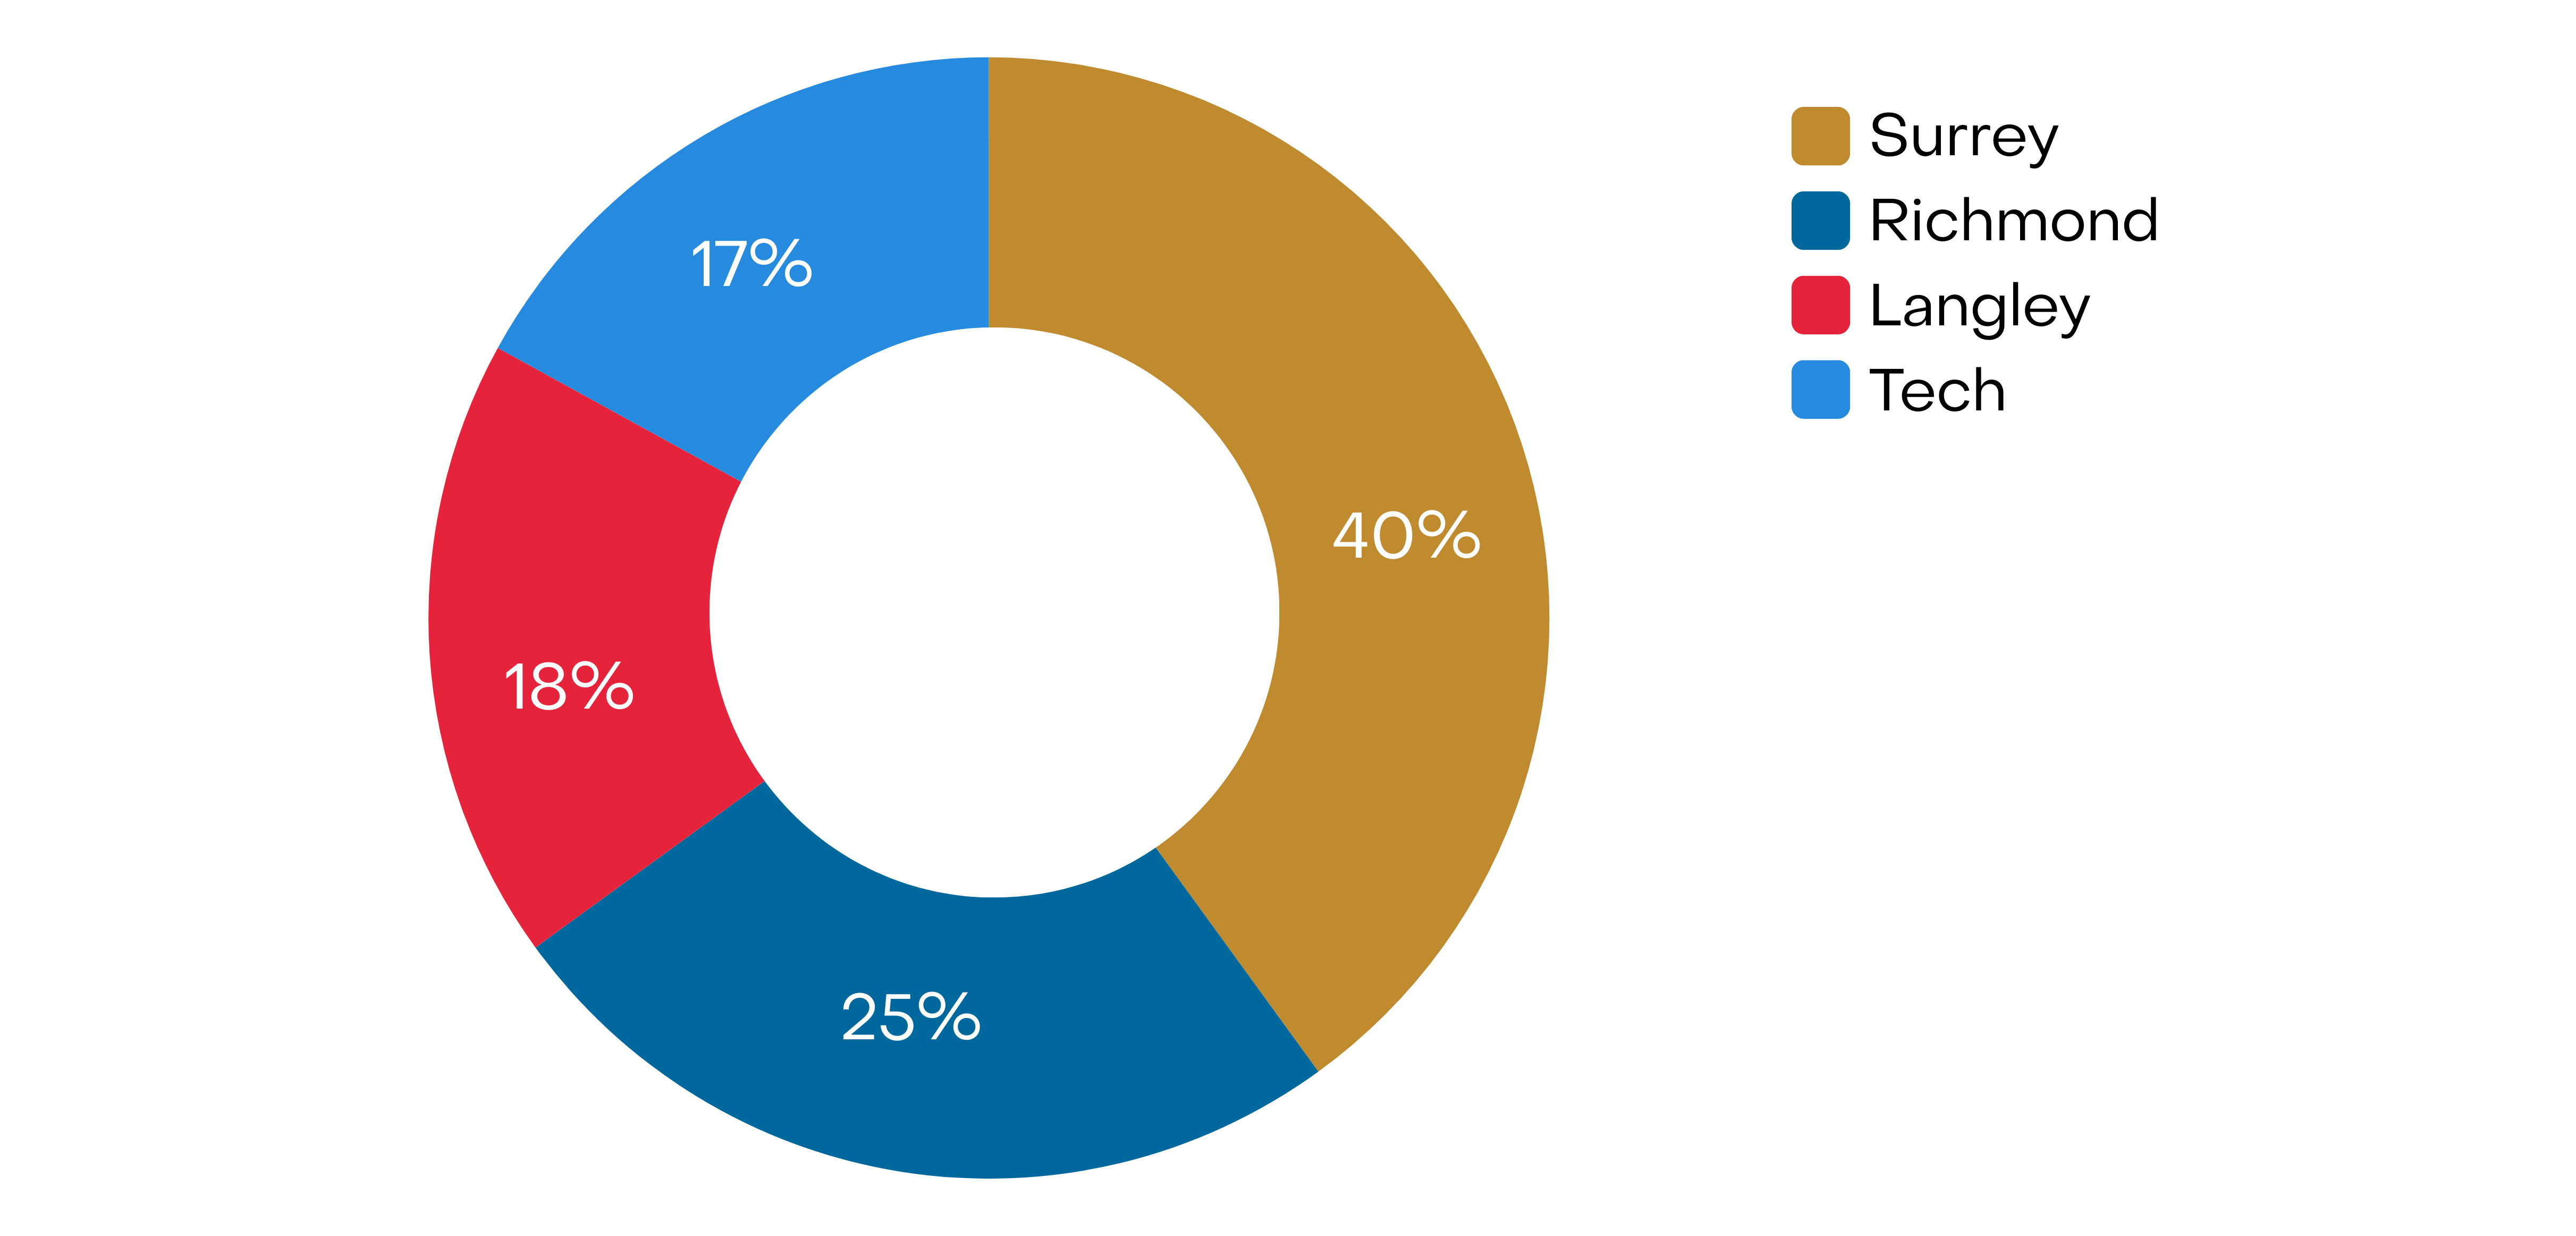
Percentage of Greenhouse Gas Emissions Consumption by Campus
Transportation and Universal Accessibility

Rick Hansen Gold Certification
is required for all new KPU buildings, improving accessibility for the KPU community.

20 electrical vehicle
charging stations
on KPU’s campuses: 6 (level 2) on Richmond Campus, 4 (level 1) on Surrey Campus, and 10 (level 1) on Tech Campus.
DESIRED TREND ↑ increase
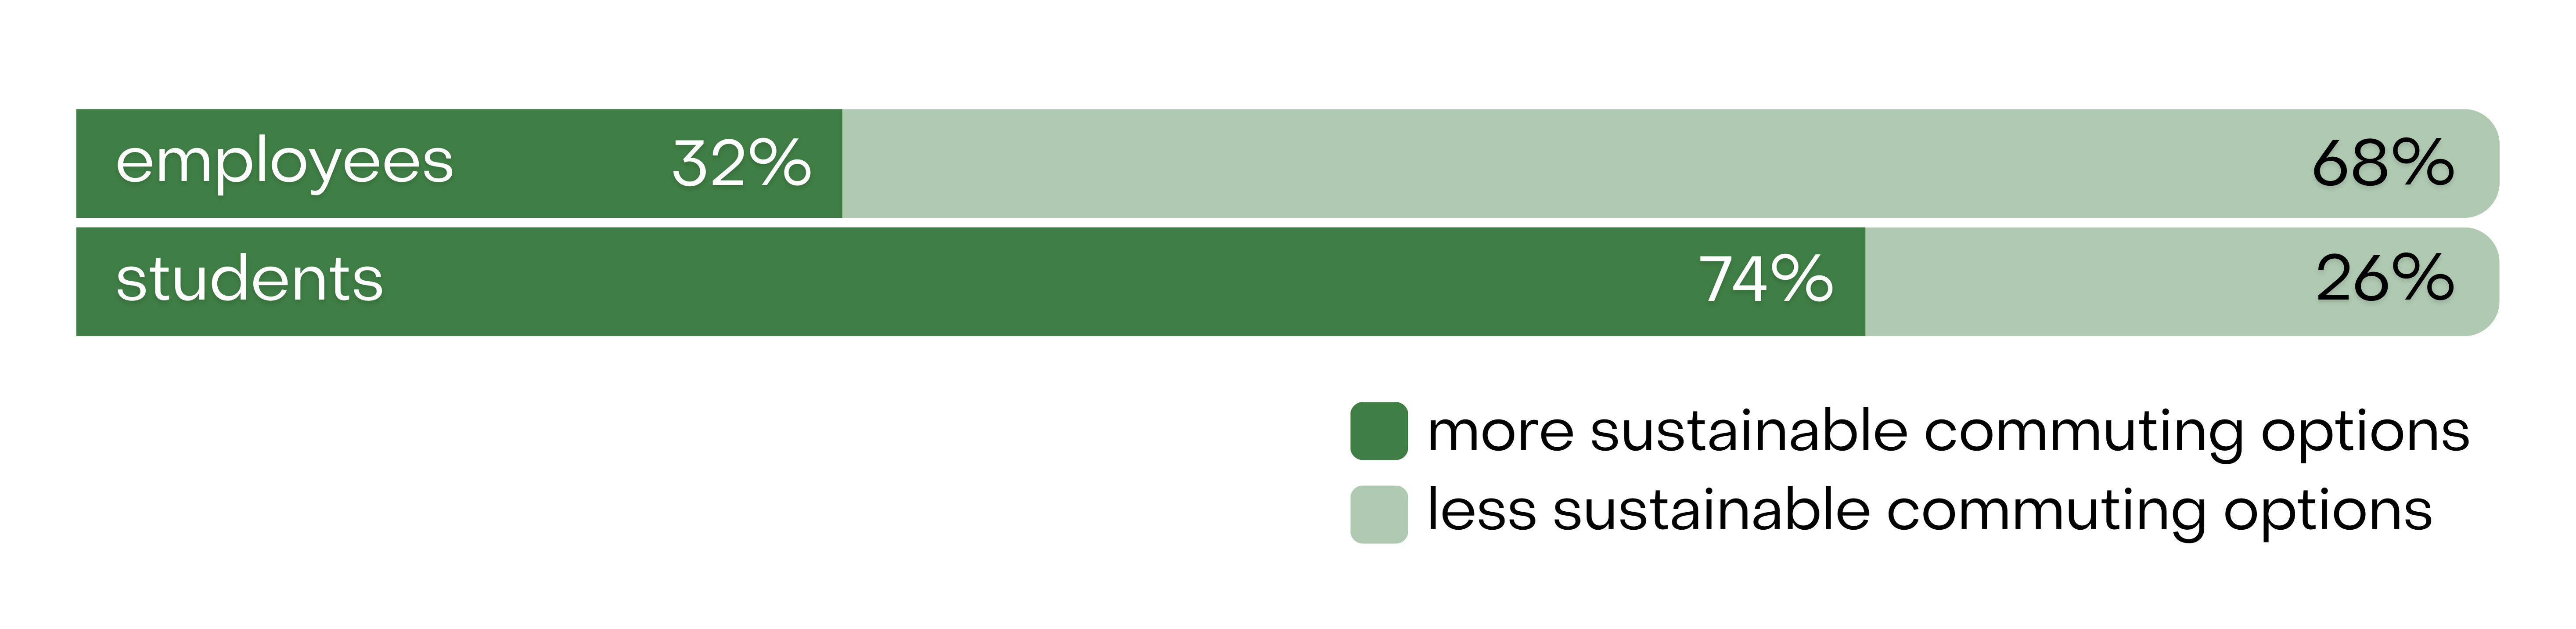
74 % of students are commuting
to campus sustainably
such as carpooling, transit, biking, or by electric powered vehicle. Only 32% of employees take a more sustainable commuting option.
DESIRED TREND ↑ increase
Learn More about Transportation and Universal Accessibility
These data sets provide insights on how the KPU Community is commuting to, from and between KPU’s five campuses based on finding from the 2024 Sustainability Survey. More sustainable commuting options include options to get to and from campus. “More sustainable commuting options” include shared vehicles (carpool, carshare, dropped off, and taxi/ride hailing), transit (bus, SkyTrain), active transportation (biking, e-biking, rolling, bicycle/scooter share, walking), drive-alone vehicles (electric/plug-in-electric drive-alone private vehicle), and others such as motorcycles, as they generally produce less greenhouse gas emissions compared to fossil-fuel operated vehicles. Scroll down to the Outreach section to learn more about the 2024 Sustainability Survey.
Campus Member Commuting Distribution
Findings based on KPU’s 2024 Sustainability Survey, read KPU’s Sustainability Report to learn more.
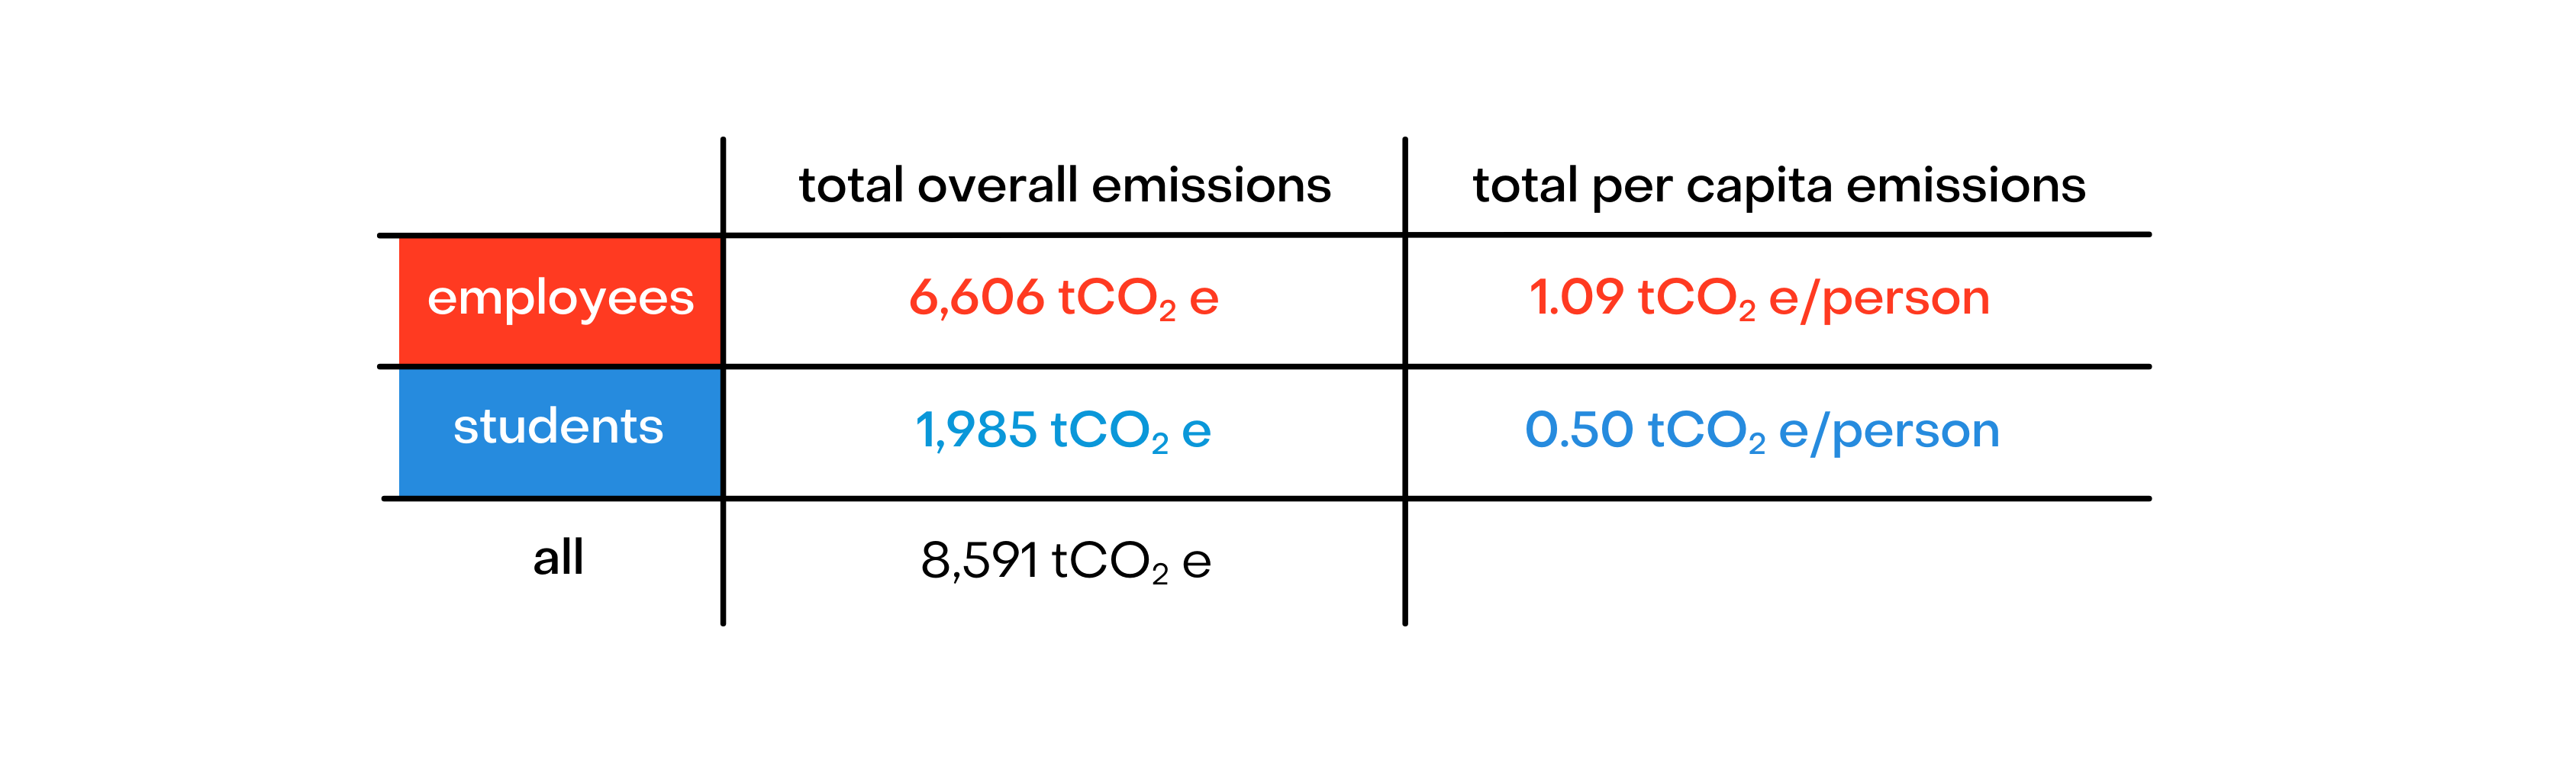
Campus Member Total and Per Capita Emissions
Findings based on KPU’s 2024 Sustainability Survey, read KPU’s Sustainability Report to learn more.
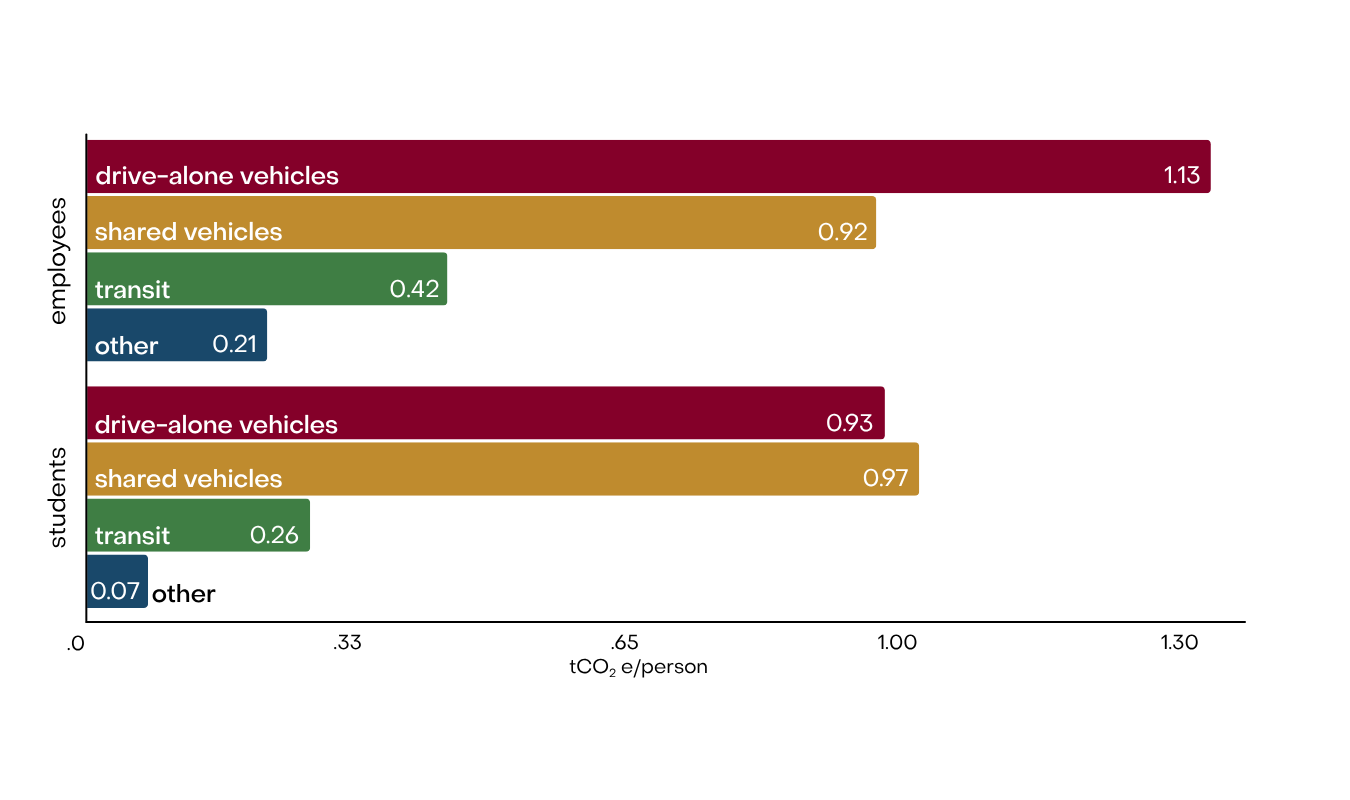
Campus Member Commuting Emissions Per Capita
Findings based on KPU’s 2024 Sustainability Survey, read KPU’s Sustainability Report to learn more.
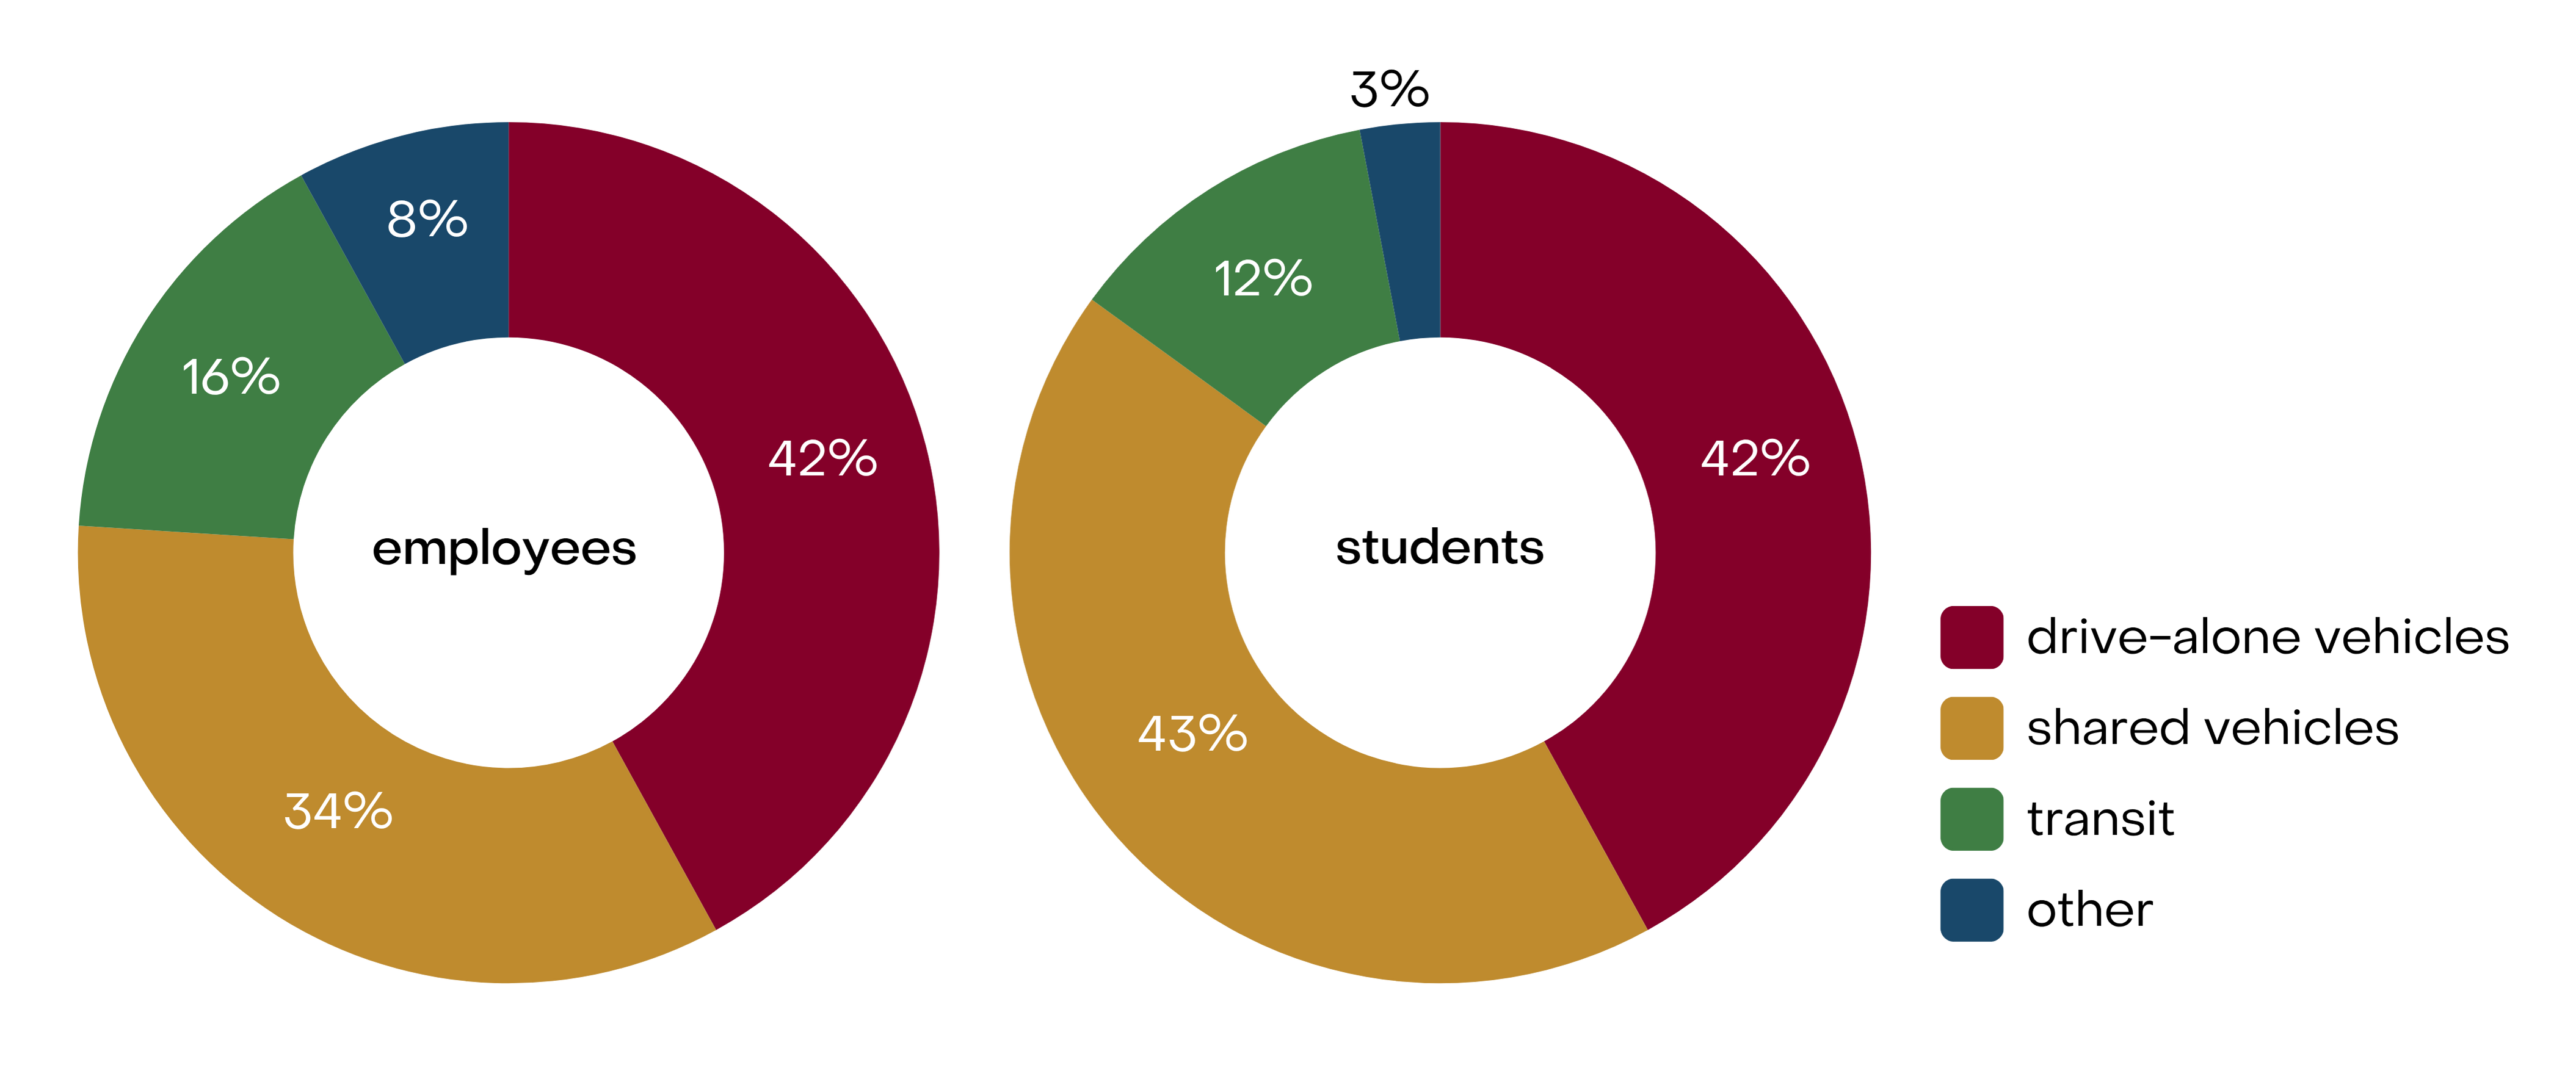
Campus Member Commute Model Split
Commute modal split is a framework for understanding how the KPU Community travels to and from and between KPU’s five campuses. Findings based on KPU’s 2024 Sustainability Survey, read KPU’s Sustainability Report to learn more.
Campus Operations

49,137 m³ of potable water used in KPU’s buildings
in 2023, excluding Civic Campus and farm schools.
DESIRED TREND ↓ decrease

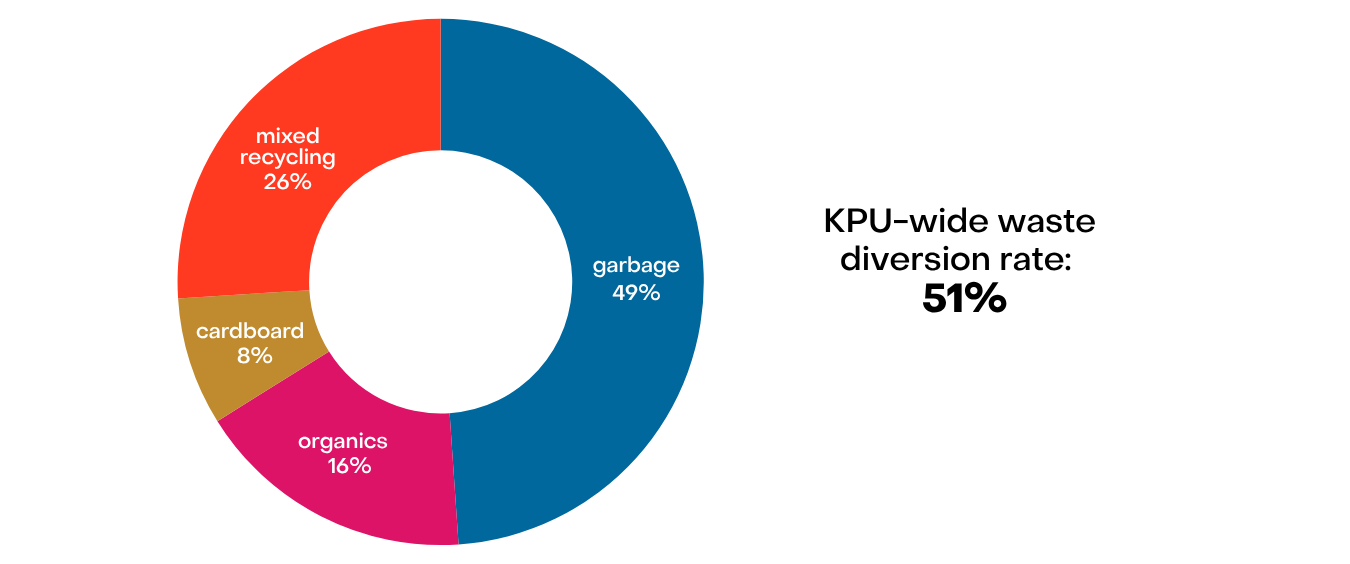
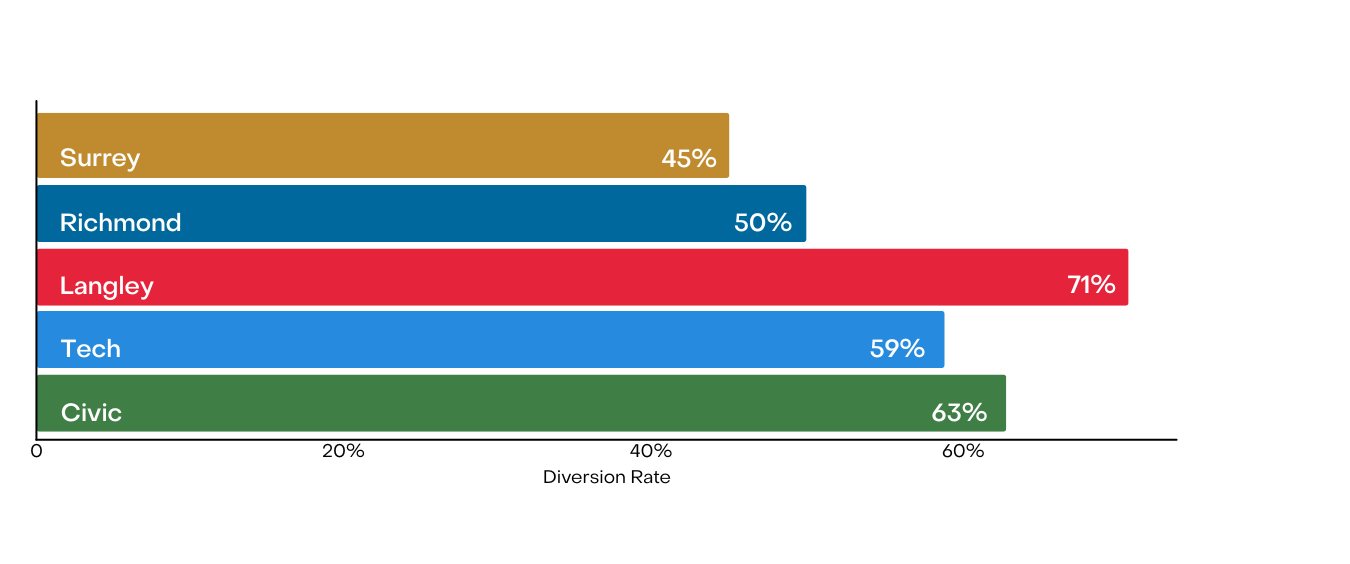
51% waste diversion rate KPU-wide
in 2024, with 142 metric tonnes recycled and 58 metric tonnes composted.
DESIRED TREND ↑ increase
Learn More about Campus Operations
Waste Diversion Rate 2024
Waste Diversion Rate per Campus 2024
Land Stewardship

33% of students consider water conservation & quality their top sustainability priority
finding from the 2024 Sustainability Survey.

~35+ Wild Spaces walks
since 2021
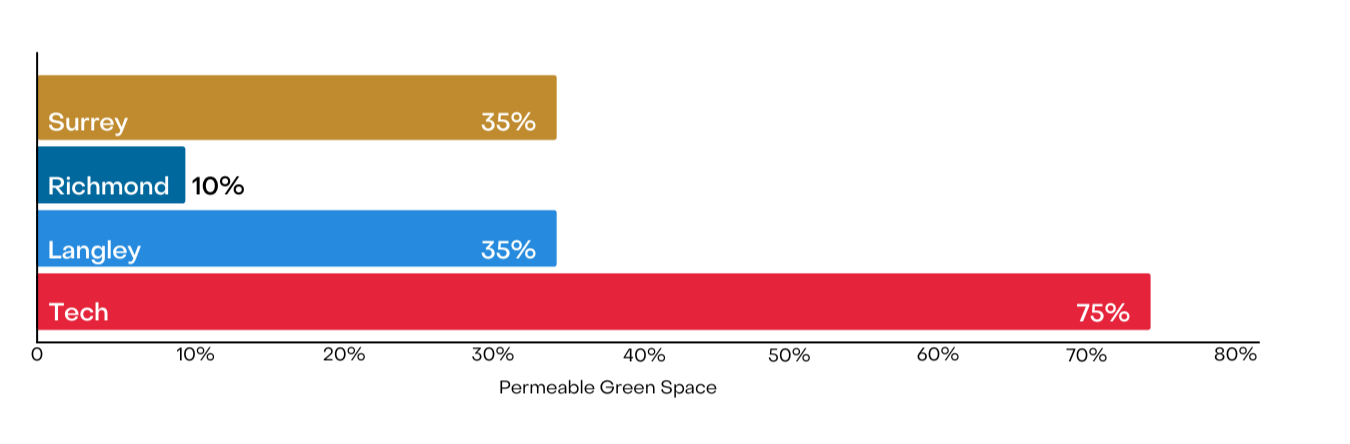
39% average permeable green space
across KPU Surrey, Richmond, Langley, and Tech Campuses.
DESIRED TREND ↑ increase
Learn More about Land Stewardship
Permeable Green Space Per Campus 2024
Outreach
20 departments, faculties, and student clubs
participated in Sustainable Development Goals Month 2025
DESIRED TREND ↑ increase

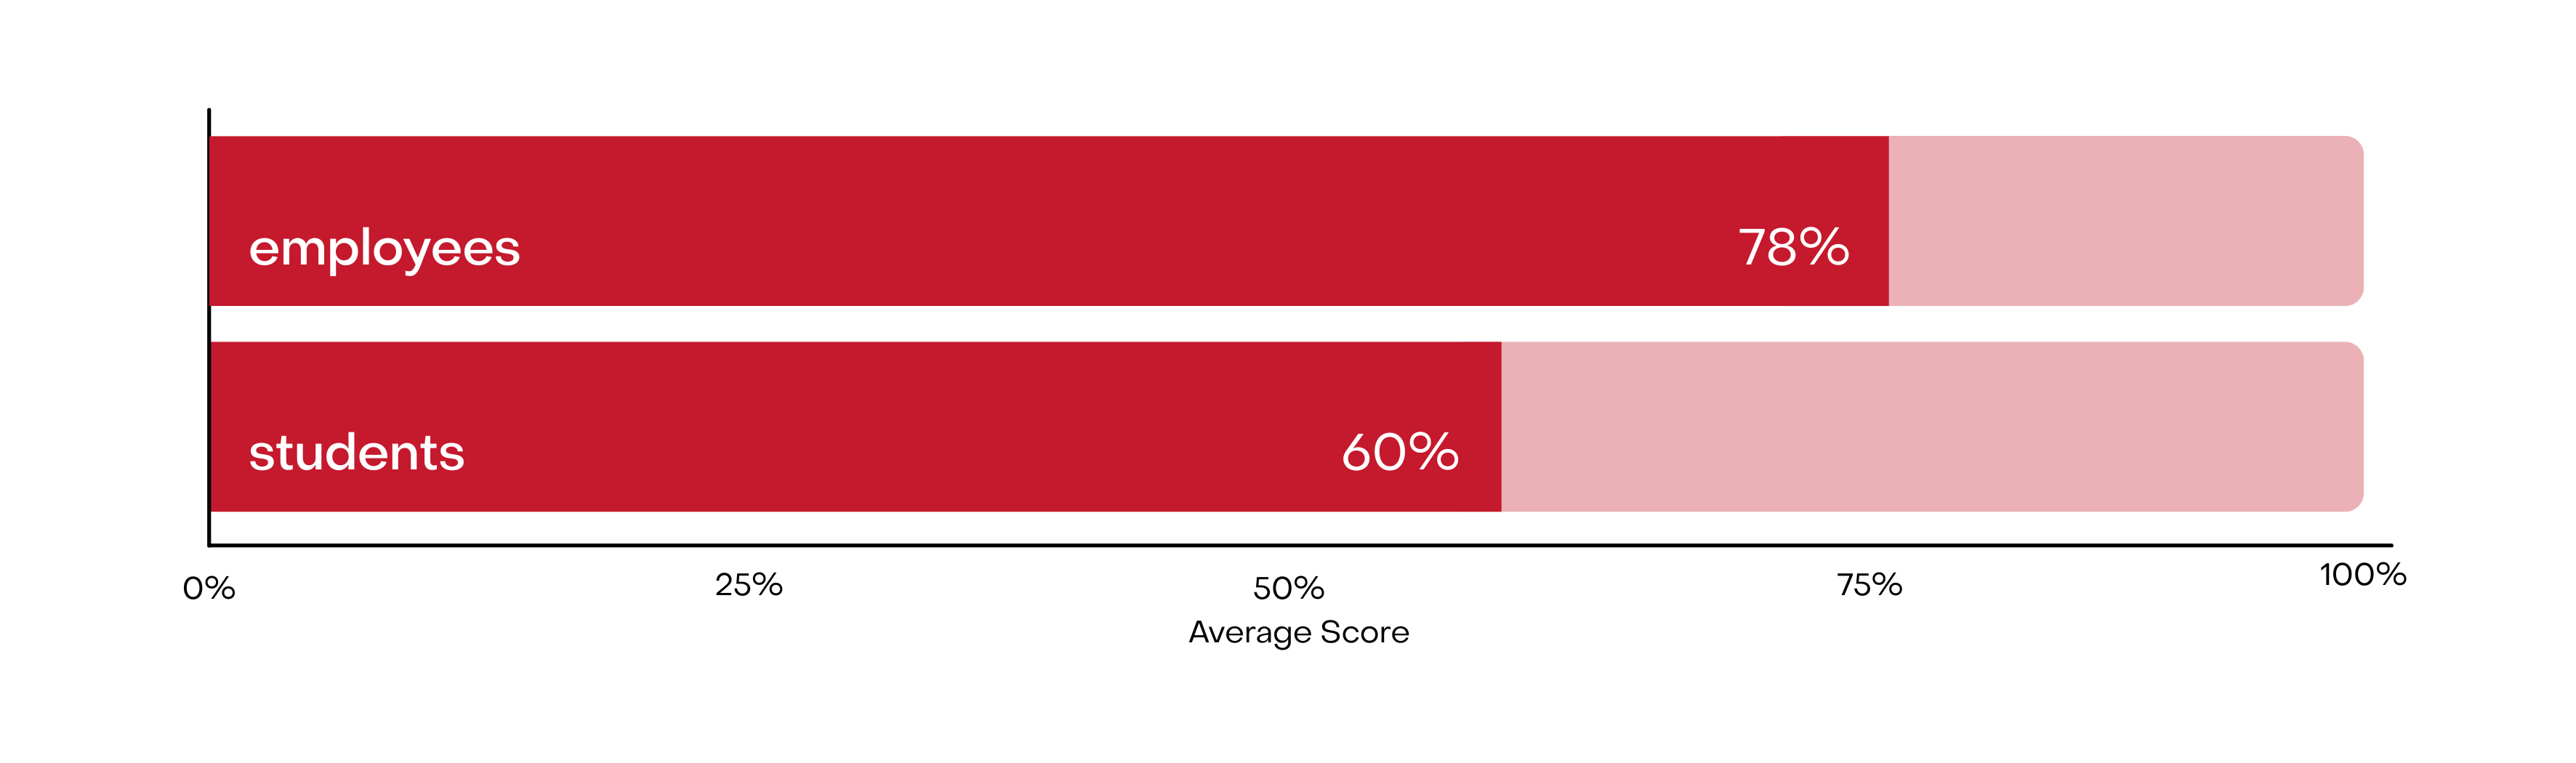
Average sustainability quiz score: employees 78%
students 60%
finding from the 2024 Sustainability Survey.
DESIRED TREND ↑ increase

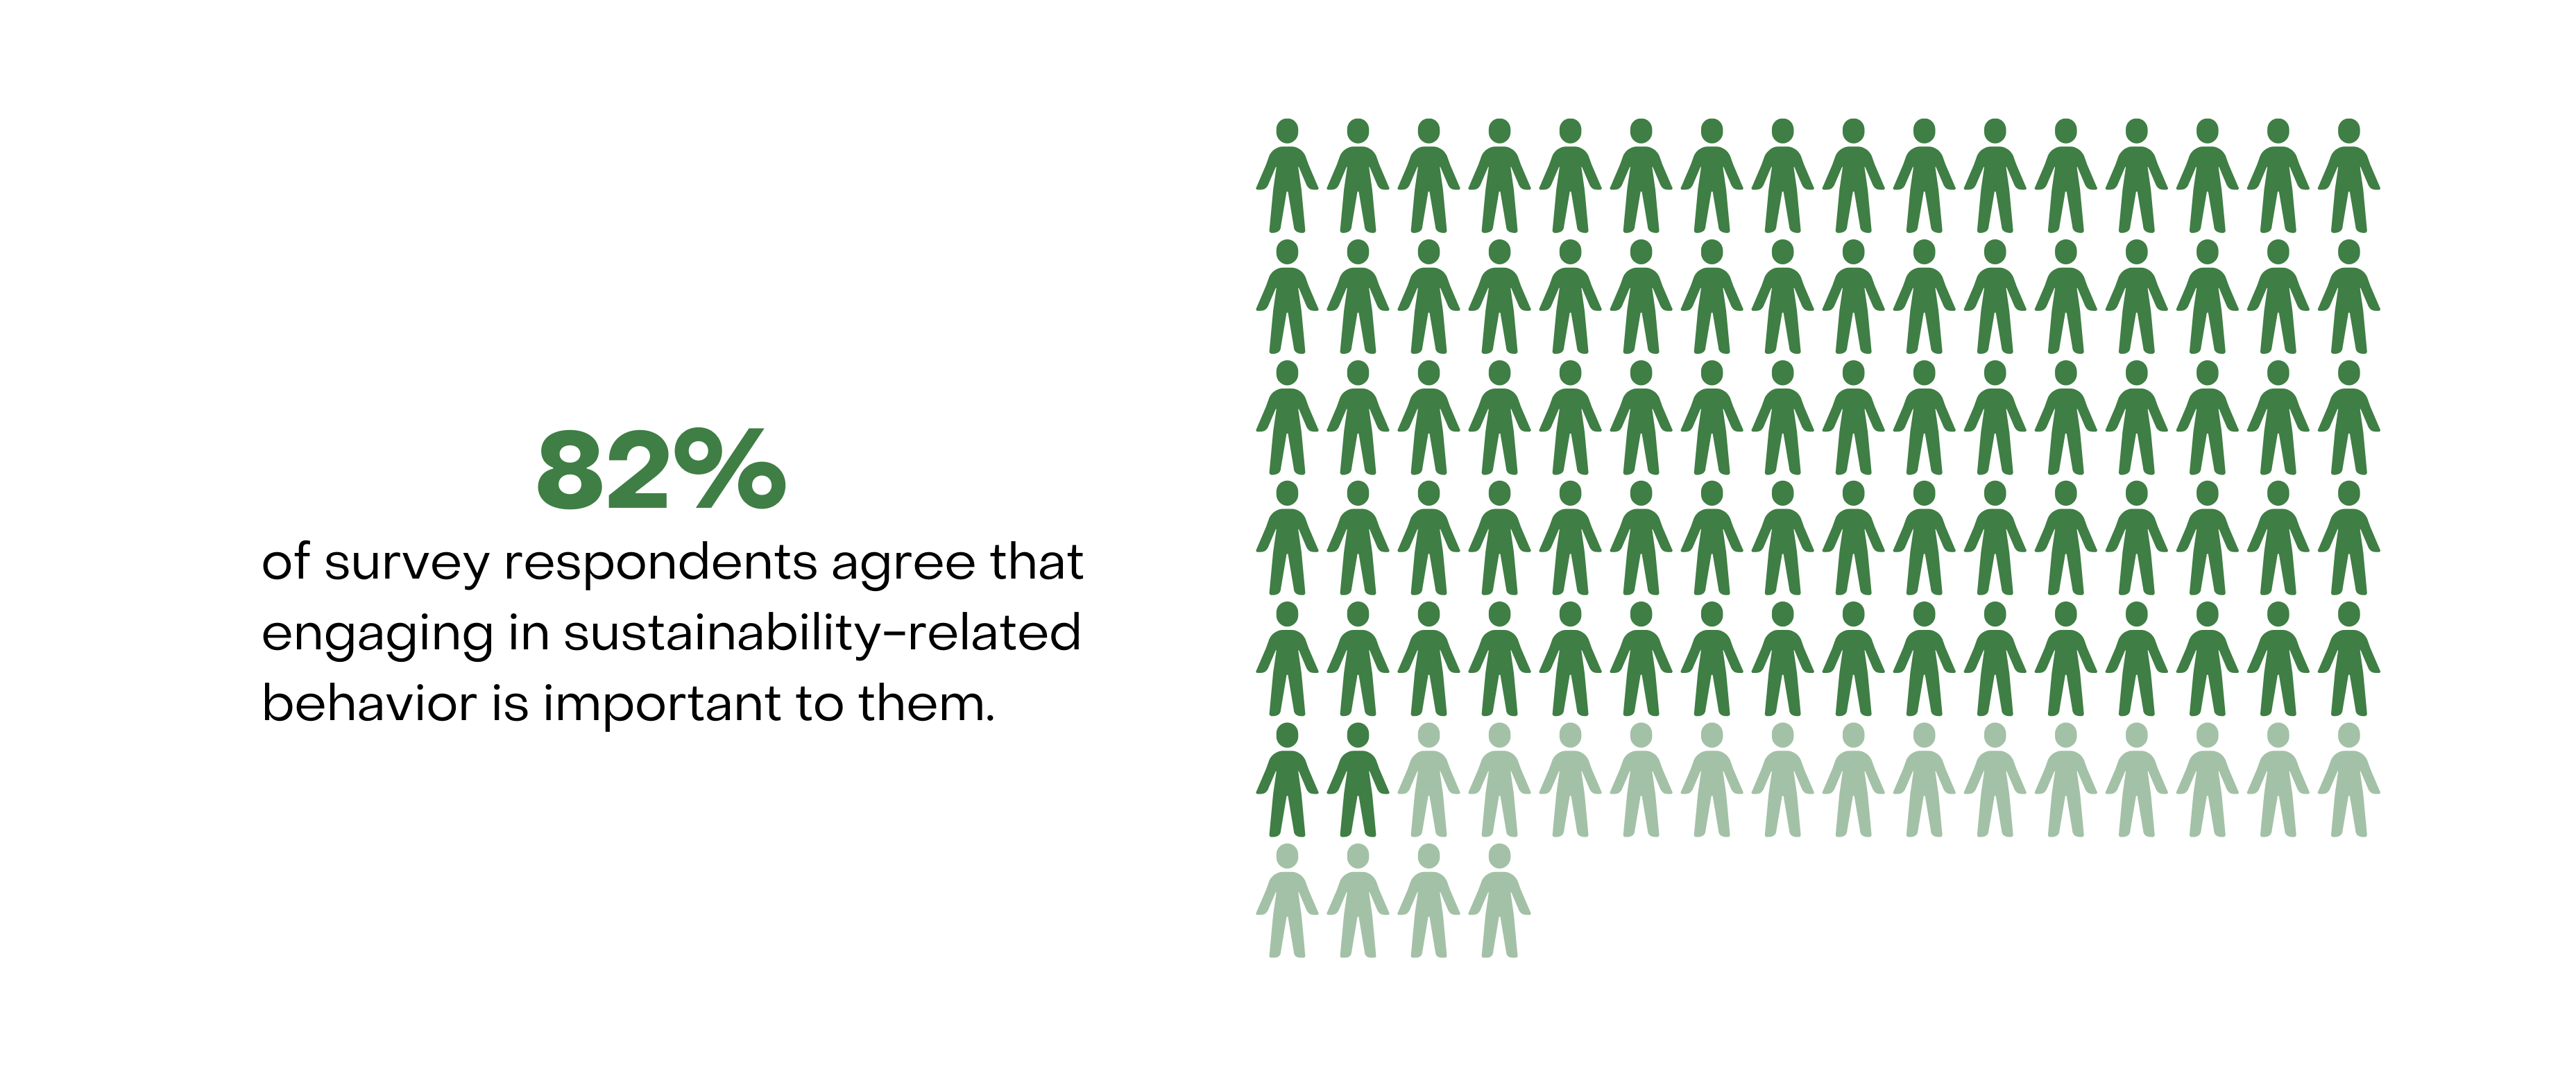
82% say engaging in sustainability-related behavior is important
finding from the 2024 Sustainability Survey.
DESIRED TREND ↑ increase
Learn More about Outreach
KPU 2024 Sustainability Survey
The Office of Sustainability and the Office of Planning and Accountability launched KPU’s first Sustainability Survey in February 2024. This survey aimed to assess the KPU community’s understanding of sustainability, including the role of sustainability in everyday decision-making; the use of specific services at KPU; and the community’s transportation choices to, from, and between campuses.
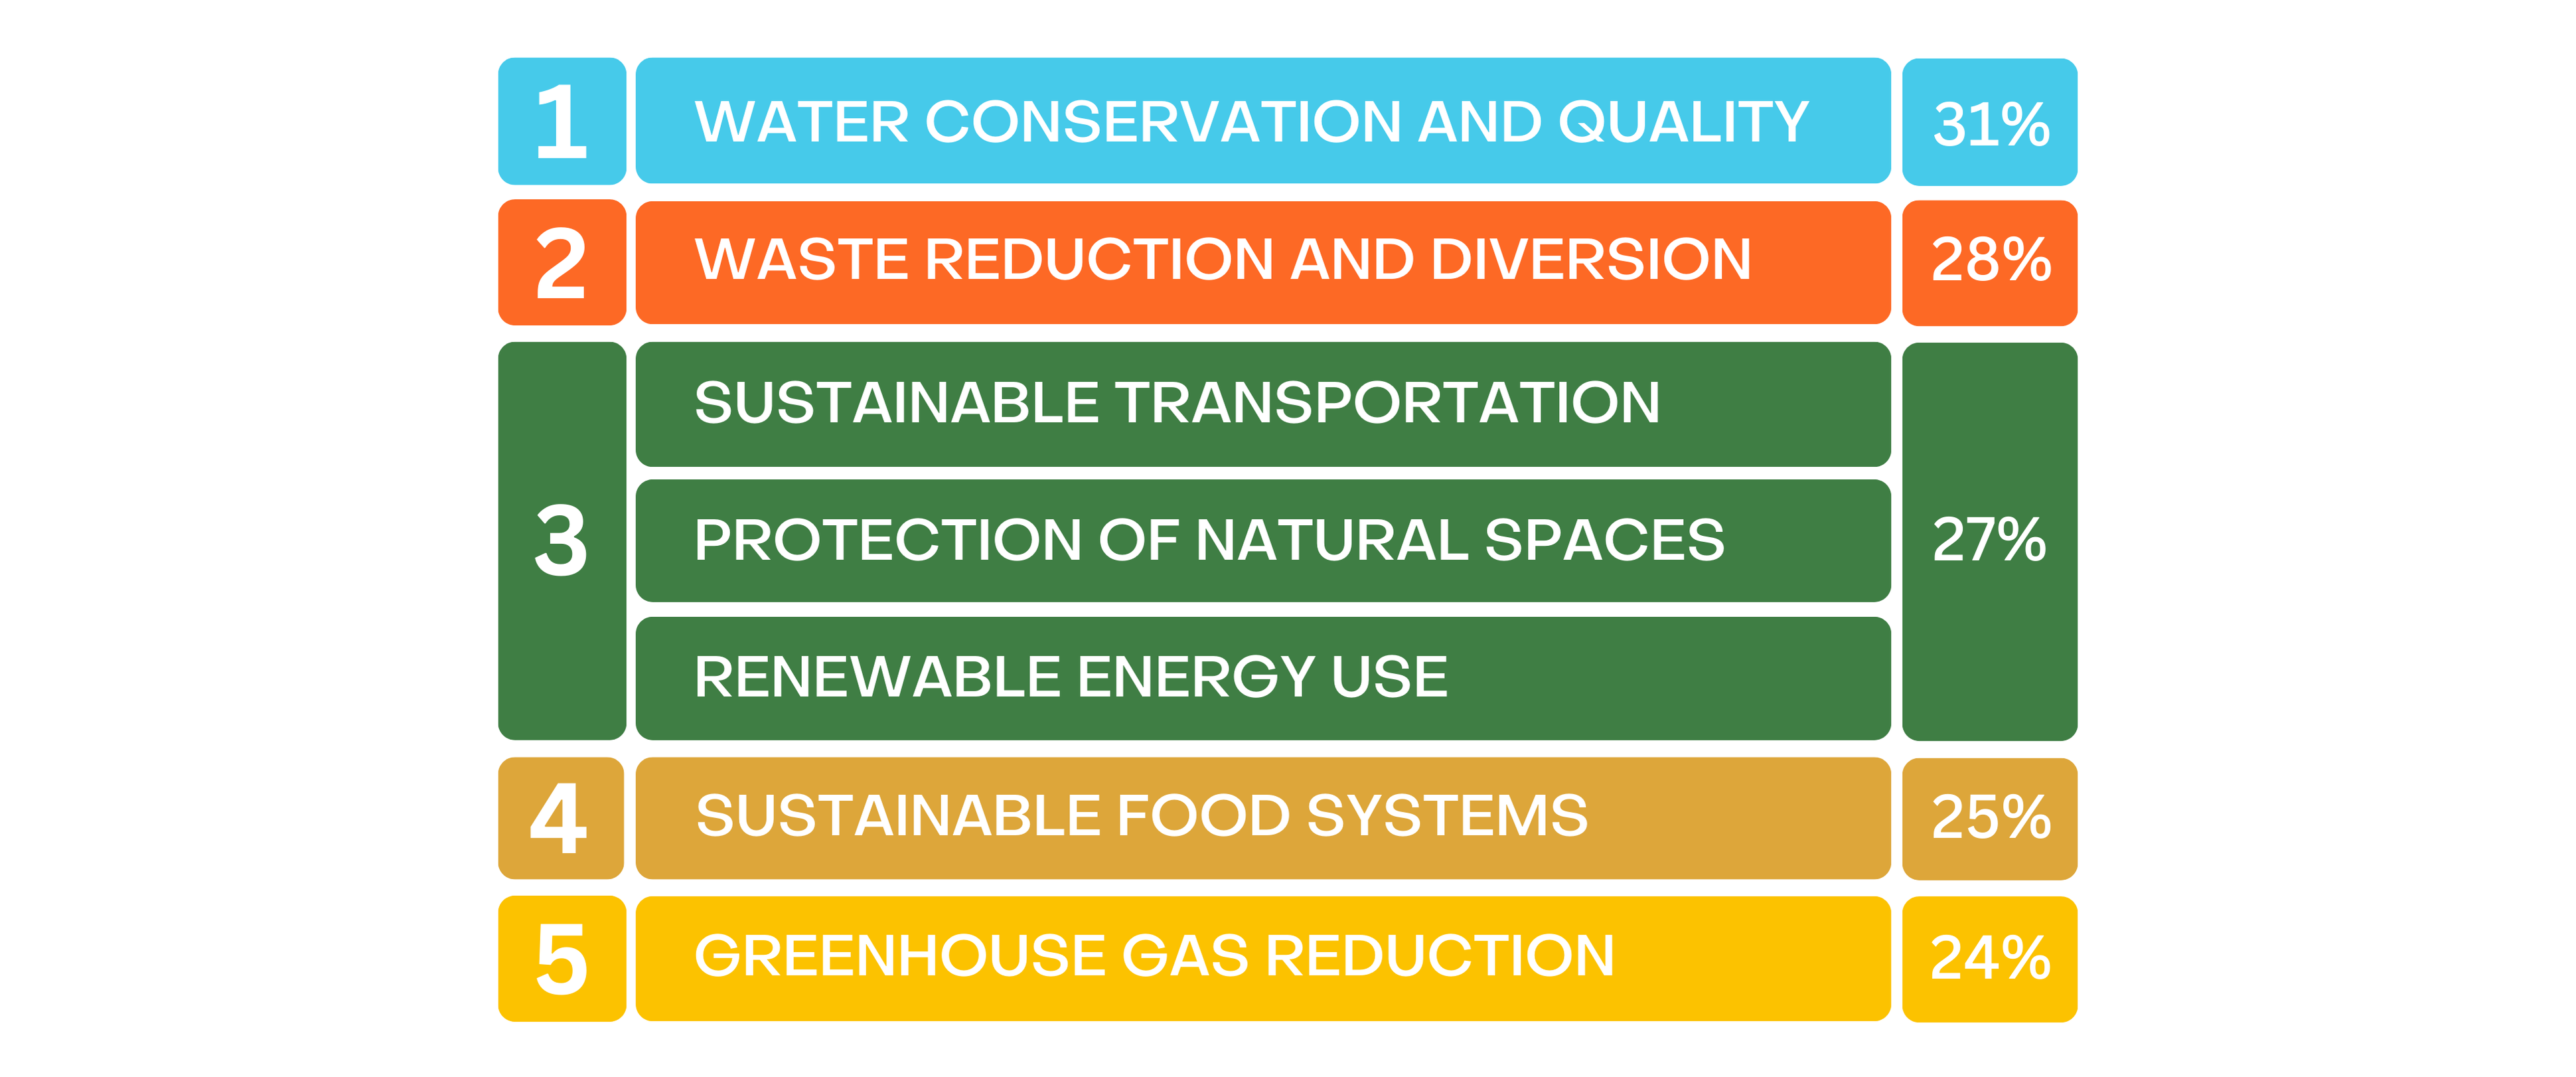
Sustainability Areas of Interest
Survey respondents shared what areas of sustainability they are most interested in. Read KPU’s Sustainability Report to learn more about the findings of the 2024 Sustainability Survey.
Average Sustainability Quiz Score
The 2024 Sustainability Quiz was administered to understand the level of awareness of sustainability topics at KPU and within Metro Vancouver, including climate change, responsible production and consumption, and society and economy. Read KPU’s Sustainability Report to learn more about the findings of the 2024 Sustainability Survey.
Education
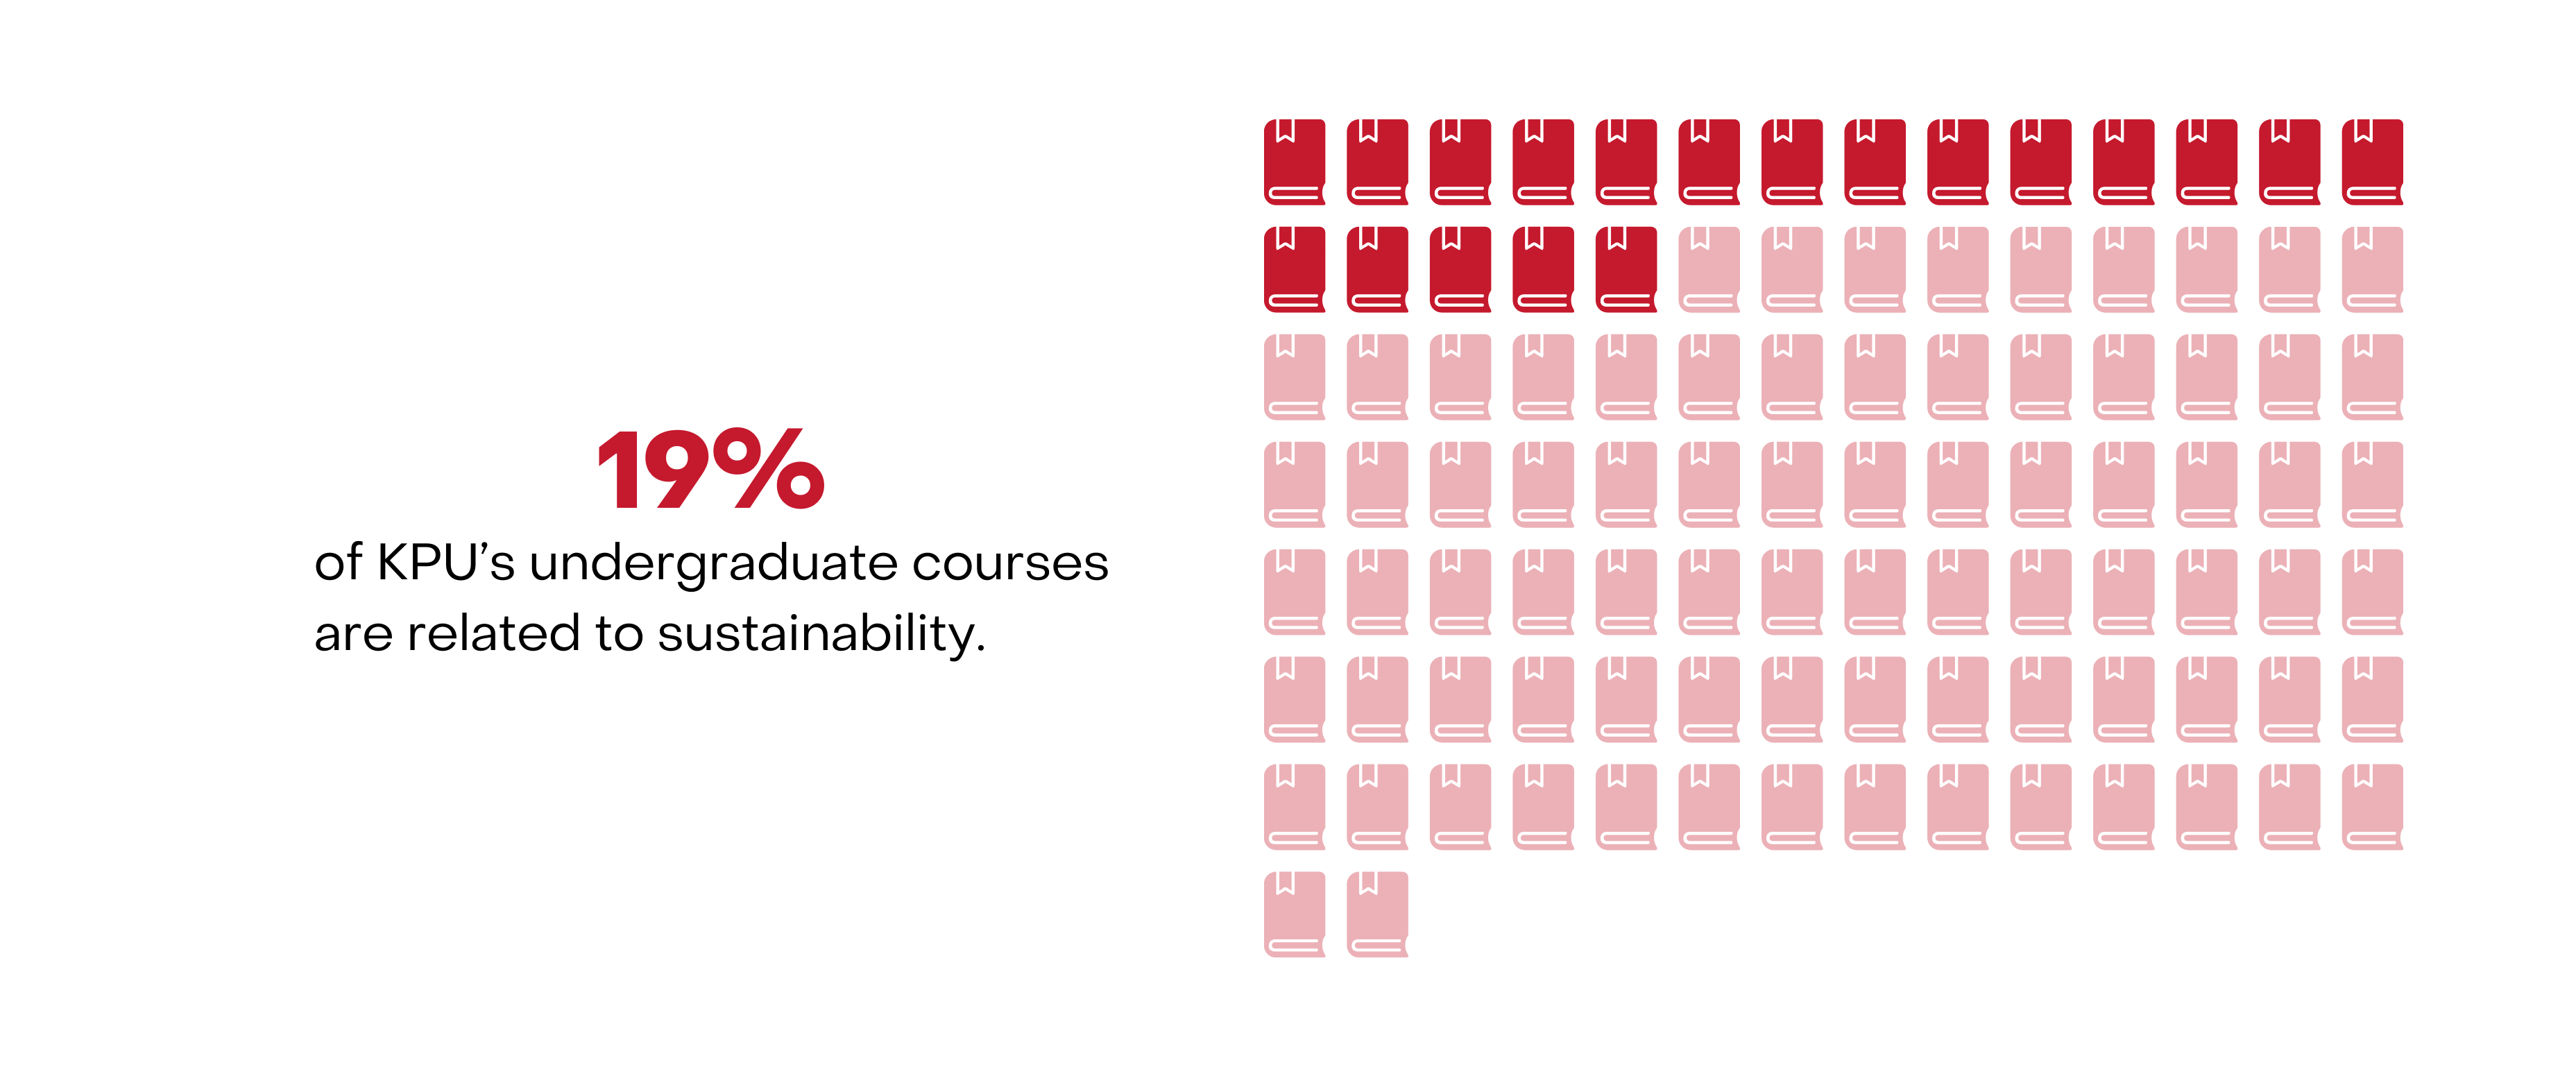
19% of courses include curriculum related to sustainability challenges
such as climate change, global poverty and inequality, natural resource depletion, and environmental degradation.
DESIRED TREND ↑ increase
KPU achieved a STARS silver rating
from the Association for the Advancement of Sustainability in Higher Education.
DESIRED TREND ↑ increase
60% of academic departments offer a sustainability course
either related to or focusing on sustainability .
DESIRED TREND ↑ increase
Learn more about Education
Percentage of Courses Related to Sustainability
Includes undergraduate courses with curriculum related to sustainability challenges such as climate change, global poverty and inequality, natural resource depletion, and environmental degradation.
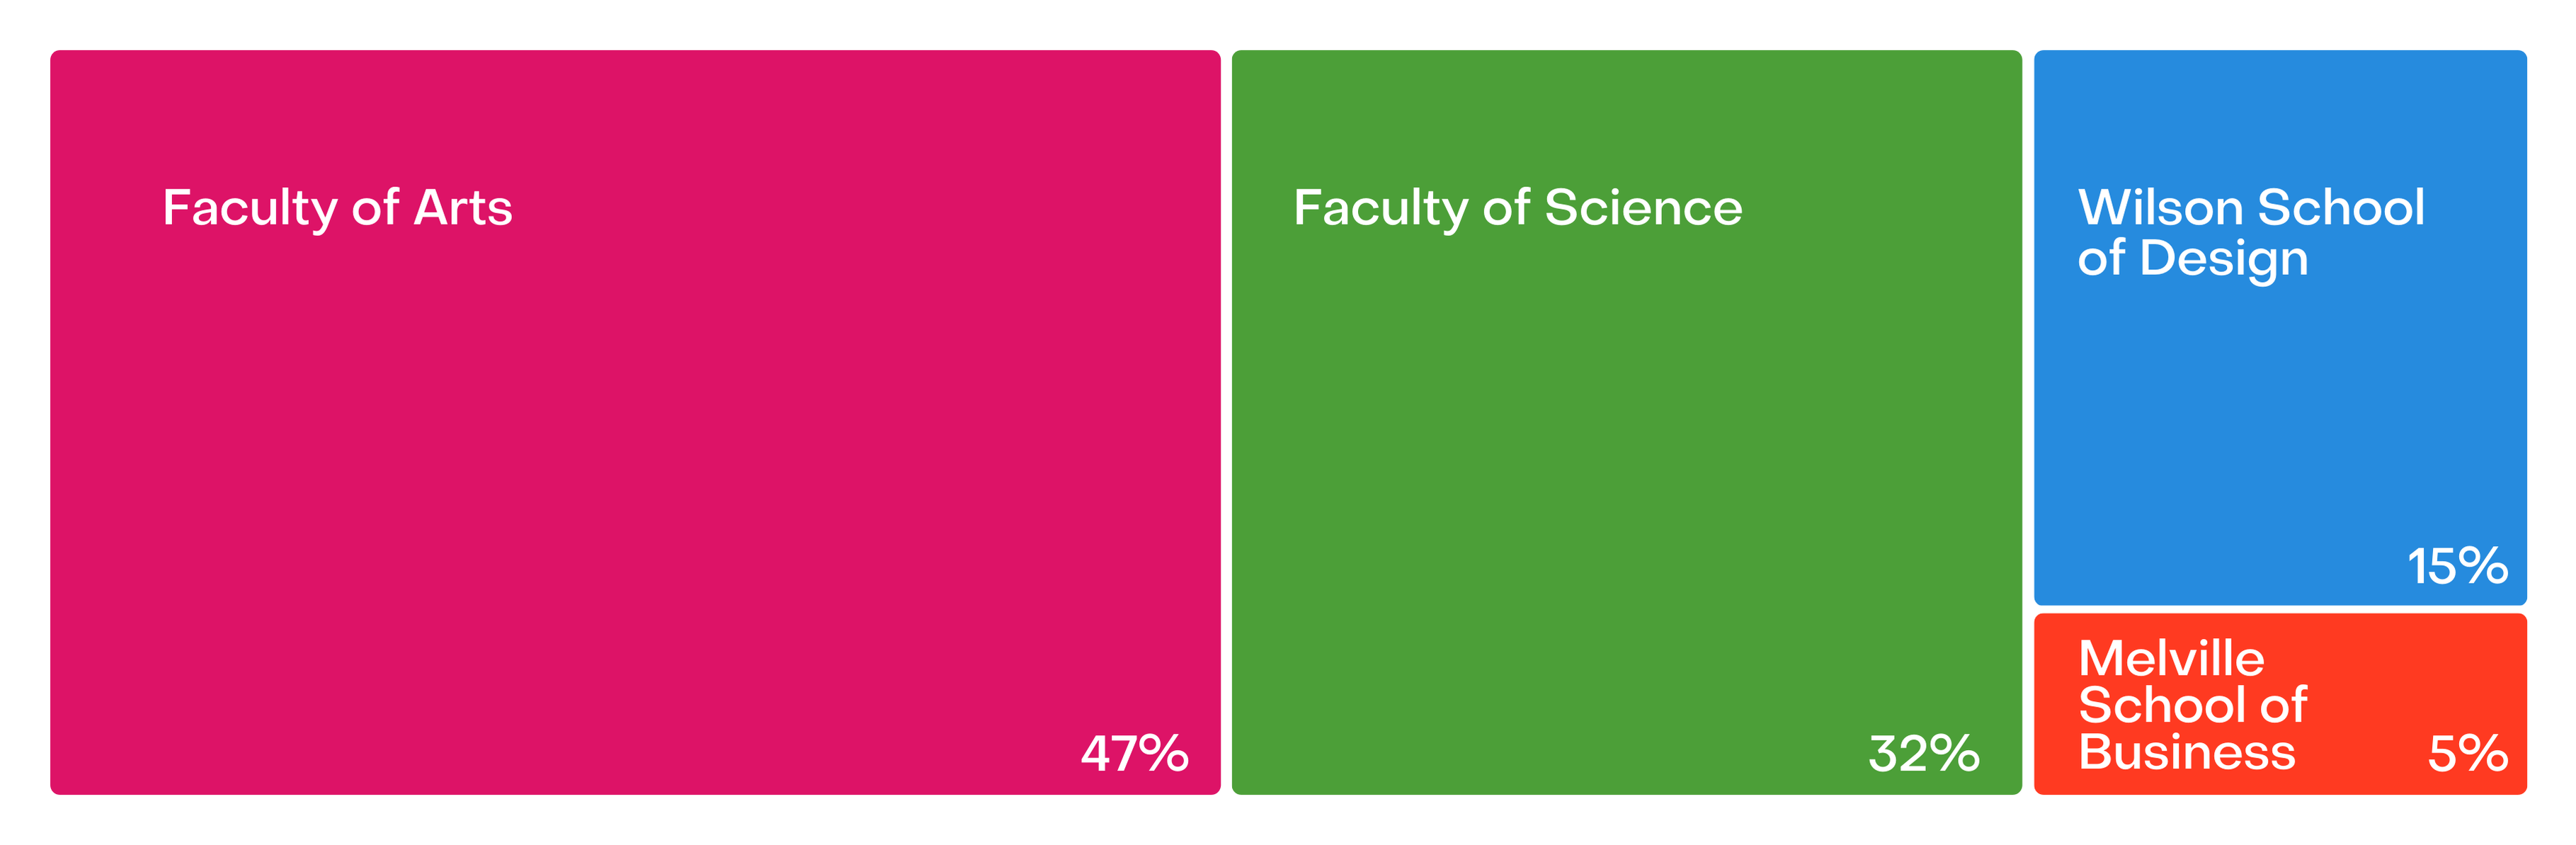
Percentage of Sustainability Courses per Faculty
Independent research, practicums, trades courses, methods courses, and courses like medical/practical art courses are excluded from count.
Decolonization & Reconciliation
To make KPU a more sustainable institution, it is essential to move beyond colonial systems and decision-making. The xéʔelɬ Indigenous strategic plan, which upholds Indigenous rights and promotes systemic transformation across the entire university, is a key step in this direction. Read KPU’s Sustainability Report to learn more about how KPU is embedding Indigenous perspectives into its sustainability practices, striving to decolonize its approaches, systems, and initiatives.
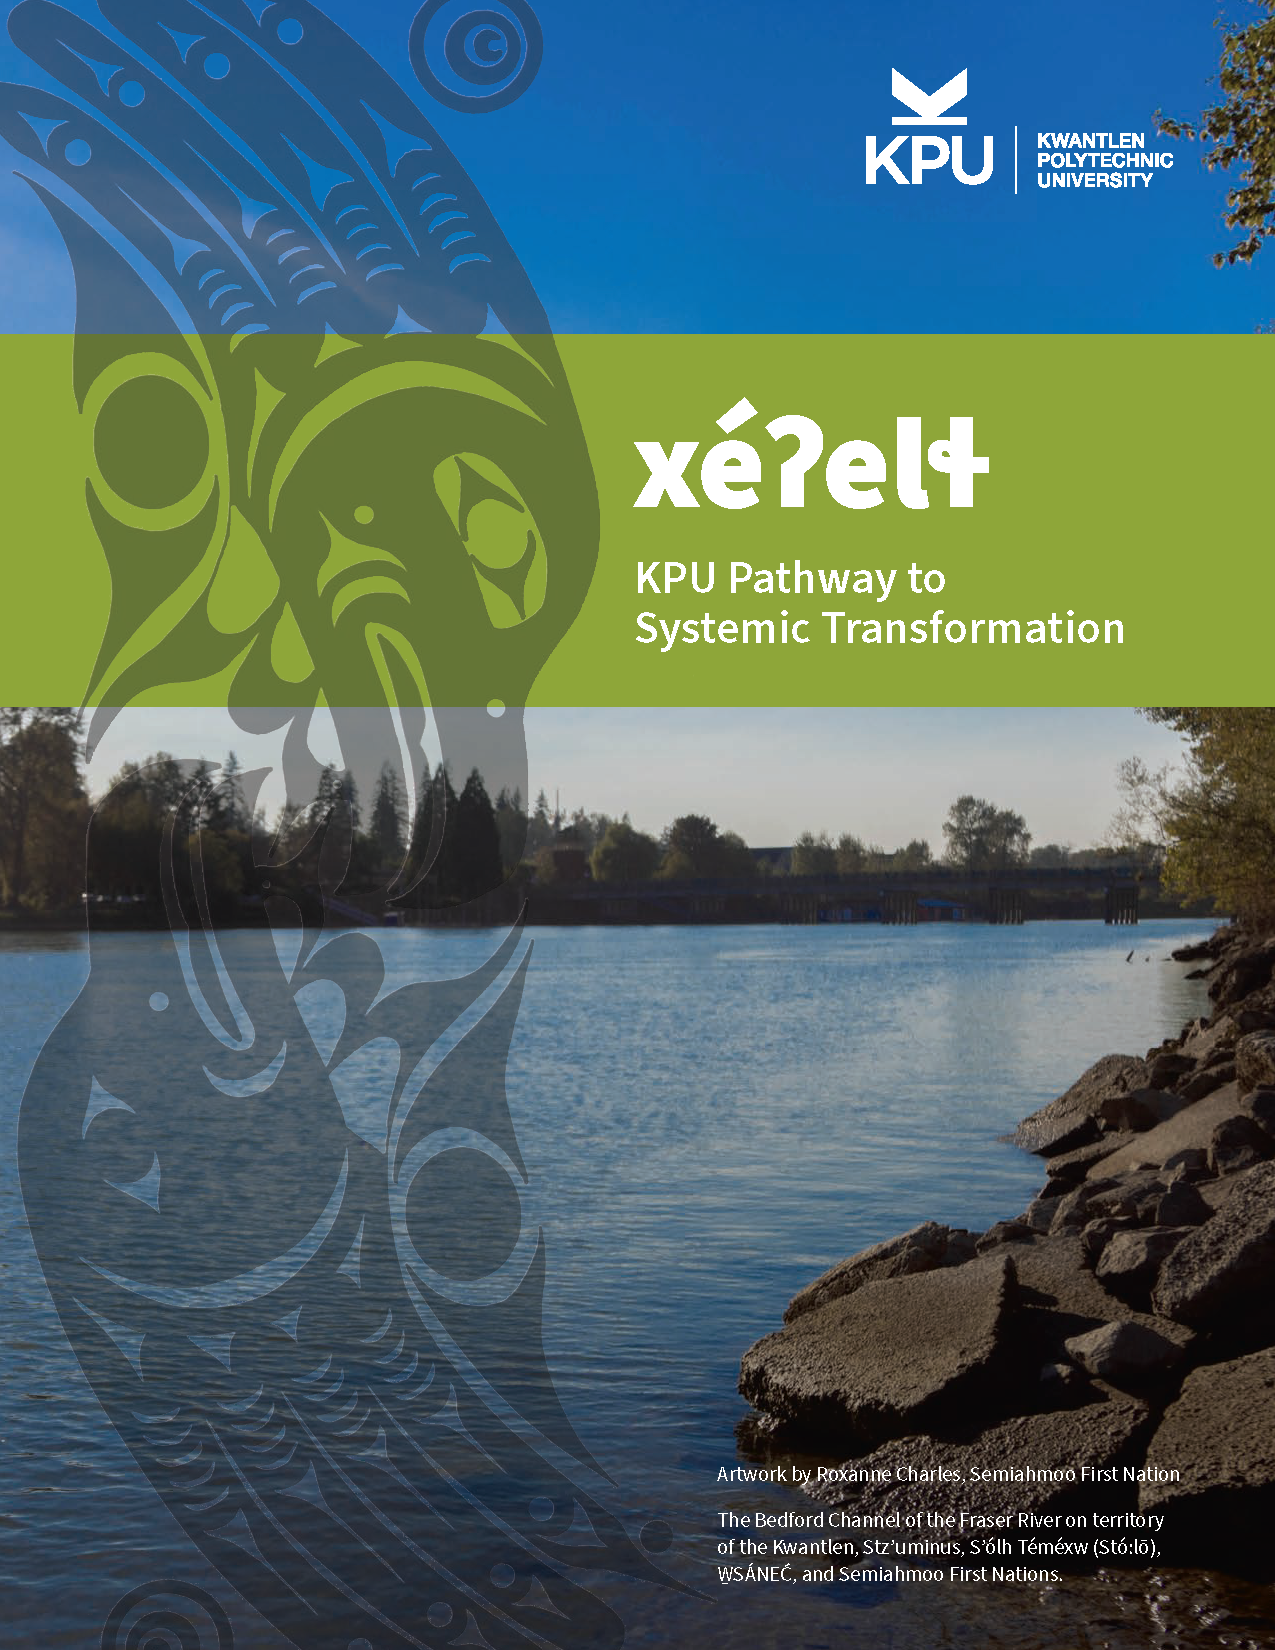
xéʔelɬ Pathway to Systemic Transformation Framework
Kwantlen Polytechnic University’s response and commitment to upholding the responsibilities expressed through the Truth and Reconciliation Commission of Canada’s Calls to Action, the Calls for Justice stemming from the Nation Inquiry into Missing and Murder Indigenous Woman, Girls and 2SLGBTQQIA people, and the United Nations Declaration on the Rights of Indigenous Peoples.
Equity & Inclusion
Sustainability necessitates a just and equitable society where all people are included, respected, protected, and provided for. KPU is committed to a holistic approach to sustainability that uplifts marginalized voices and provides opportunities for advancements for equity, accessibility, and inclusion. Visit KPU’s Office of Equity & Inclusive Communities webpage to learn more.
Equity, Diversity, and Inclusion (EDI) Action Plan
Kwantlen Polytechnic University’s Equity, Diversity, and Inclusion Action Plan includes
recommendations intended to support EDI practices throughout KPU. This plan strives
to strengthen employee awareness and understanding while addressing systemic
barriers, creating space for full participation of employees in the university community.
Accessibility Plan
Kwantlen Polytechnic University’s first-ever Accessibility Plan seeks to address identified barriers and challenges to disability justice and inclusion through a series of recommendations to enhance accessibility, equity, and inclusion for our campus community. The plan is informed by the direct experience of students and employees with disabilities who serve on KPU’s Accessibility Committee in addition to a synthesis of data from various sources, including recent surveys of students and employees. This plan identifies barriers across several categories and provides recommendations aligned with KPU's Vision 2026 themes.
Task Force on Anti-Racism: Final Report and Recommendations
Kwantlen Polytechnic University’s Task Force on Anti-Racism Final Report and Recommendations function as both a call to action and a guide that will help the KPU community take ongoing, meaningful steps to transform the university. The report highlights the need for ongoing anti-racism work, and the benefits of building and sustaining anti-racist institutions.